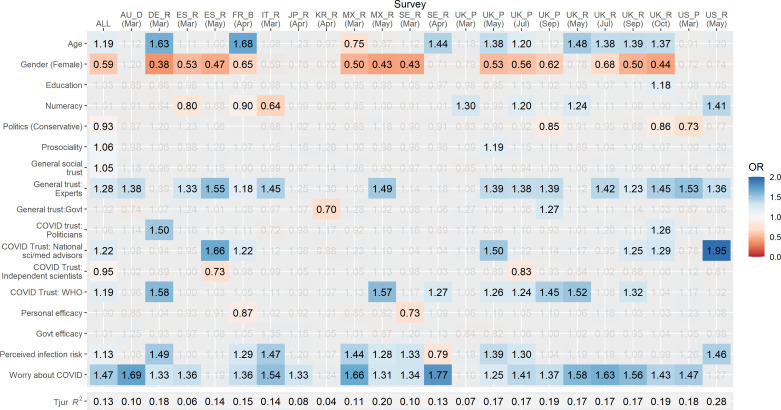
Figure 2.
Correlates of vaccine acceptance. Heat map of ORs in multivariate logistic regression model predicting stated vaccine acceptance. Columns represent individual samples, and rows represent independent variables in model. Grey values are non-significant (p>0.05). Red shading indicates a lower likelihood of reported vaccine acceptance and blue shading a higher likelihood. For space, samples are defined by their two-character ISO country code and a letter denoting participant source (B, BVA; D, Dynata; P, Prolific; and R, Respondi). Political orientation data were not collected in the French sample; this sample is excluded from pooled data.

