
Figure 8.
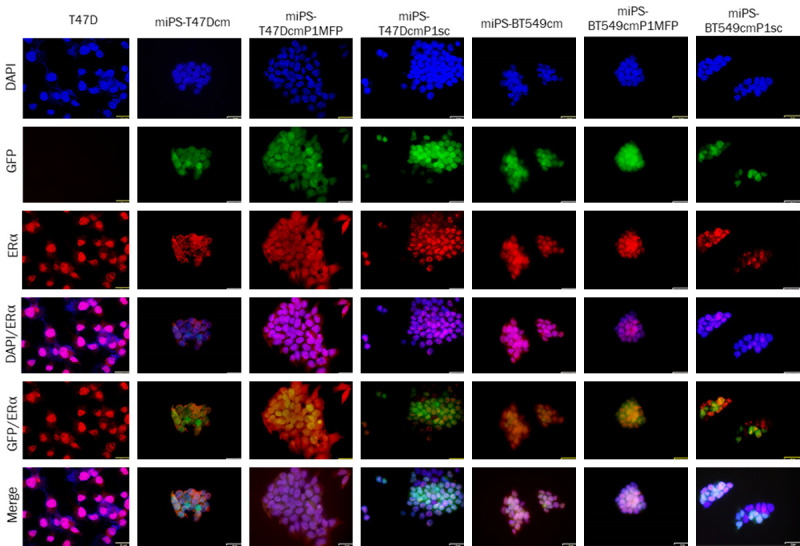
Immunocytochemical analysis of ERα in T47D, miPS-T47Dcm, miPS-T47DcmP1MFP miPS-T47DcmP1sc, miPS-BT549cm, miPS-BT549cmP1MFP and miPS-BT549cmP1sc cells. ERα immunoreactivity (red) was detected in the nuclei, cytoplasm and membrane of different cells. Scale bar = 32 µm at 40× magnification.