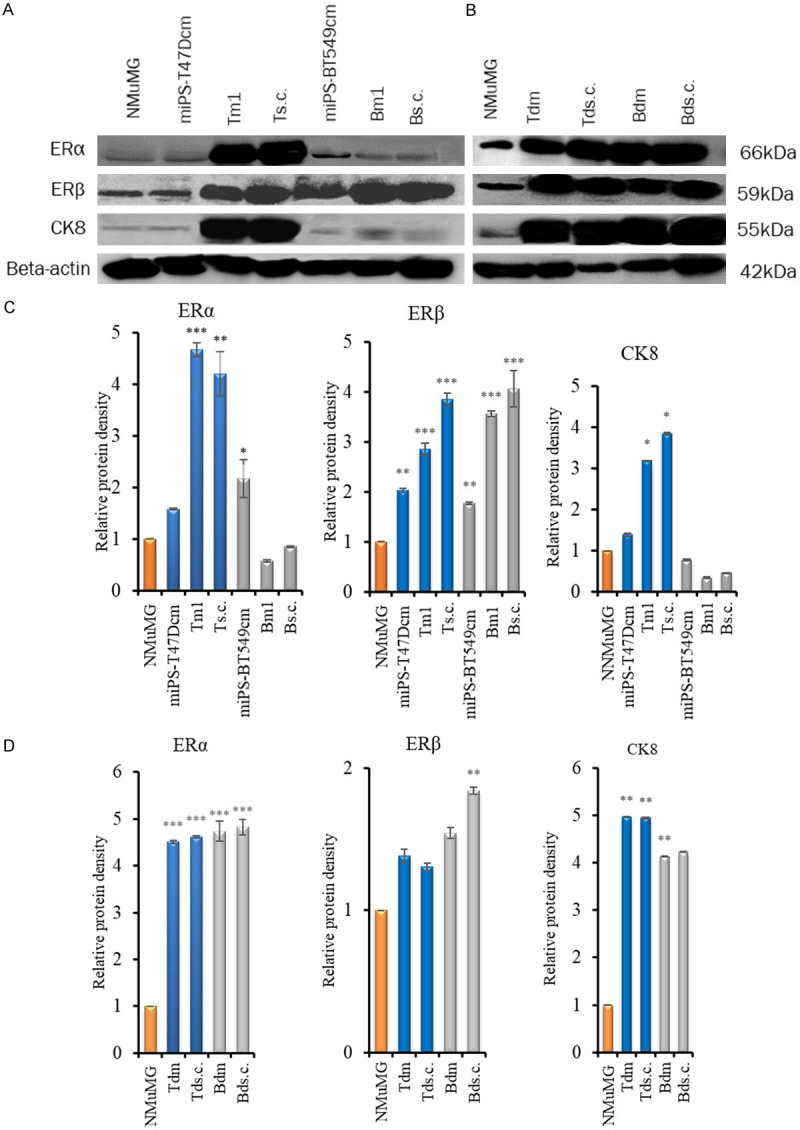
Figure 10.

Immunoreactive BC markers in different types of cells and tissues. A, B. Western blot analysis of ERα, ERβ and CK8. C, D. Densitometric analysis of the western blots with ImageJ. C. NMuMG cells, miPS-T47Dcm cells, Tm1 and Ts.c. tumors of miPS-T47Dcm cell transplants, miPS-BT549cm cells, and Bm1 and Bs.c. tumors of miPS-BT549cm cell transplants (from left to right). D. NMuMG cells, Tdm, Tds.c., Bdm and Bds.c. tumors from miPS-T47DcmP1MFP, miPS-T47DcmP1sc, miPS-BT549cmP1MFP and miPS-BT549cmP1sc tumors (from left to right). The density of each band was normalized to that of β-actin. Each bar in the graphs represents the average of three readings (mean ± SD). *P<0.05, **P<0.01, ***P<0.001.
