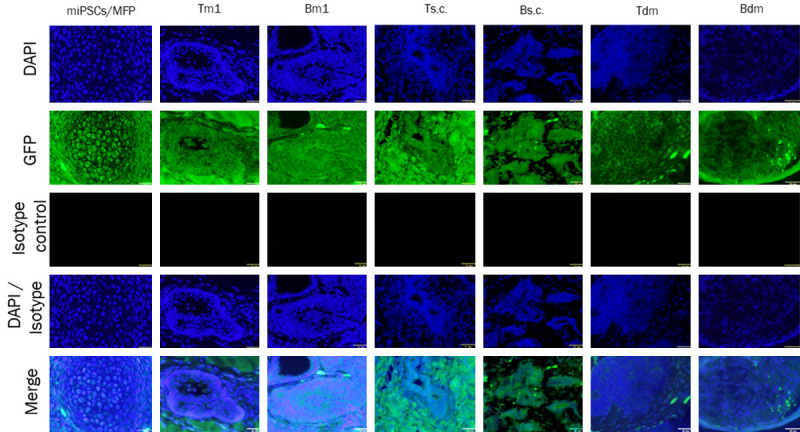
Figure 12.

Immunofluorescence analysis of isotype control in different groups by using primary isotype mouse IgG antibody. The immunoreactivity of isotype control was detected in paraffin sections of tumors miPSCs/MFP, Tm1, Bm1, Ts.c., Bs.c., Tdm and Bdm. Scale bar = 32 µm at 40× magnification.
