
Figure 4.
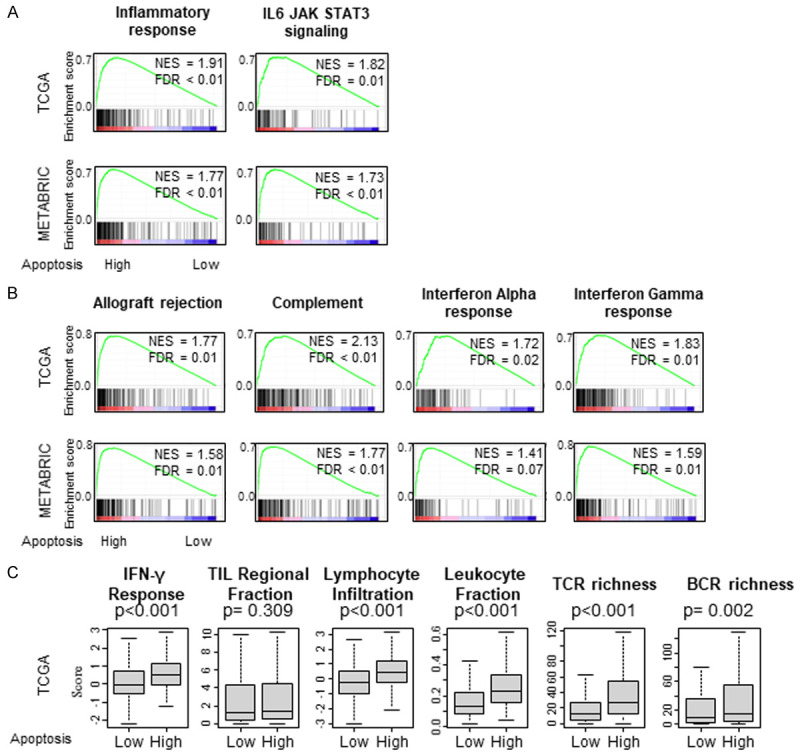
Gene Set Enrichment Assay (GSEA) apoptosis score in TCGA and METABRIC cohorts. Correlation plot of (A) Inflammation-related gene sets; Inflammatory response, IL6-JAK-STAT3 signaling, (B) Immune response gene sets; Allograft rejection, Complement, Interferon (IFN)-α response and Interferon (IFN)-γ response, with normalized enrichment score (NES) and false discovery rate (FDR). (C) Comparison of Thorsson’s score between low and high apoptosis tumors in the TCGA cohort. Boxplots of the comparison with Interferon (IFN)-γ response, Tumor infiltrating lymphocyte (TIL) regional fraction, Lymphocyte infiltration signature, Leukocyte fraction, T cell receptor (TCR) richness and B cell receptor (BCR) richness. The median was used as cut-off to divide into high and low score groups within the TCGA cohort. Mann-Whitney U test was used to calculate P values. Turkey type box plots show median and inter-quartile level values.