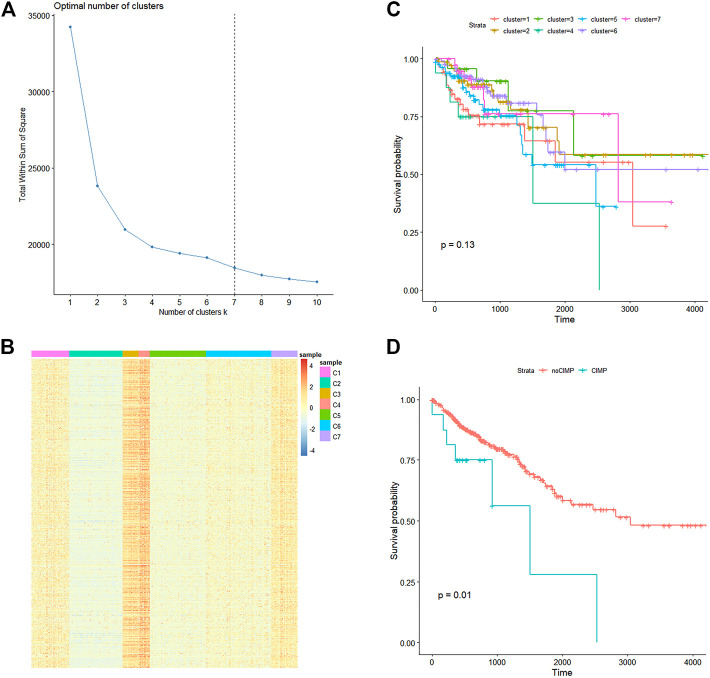
FIGURE 1.
Methylation landscape of 407 CRC samples in the TCGA-COAD dataset. (A) Line graph of total within sum of square (Y-axis) vs. cluster number (X-axis) obtained through the within-cluster sum of squares method which defined the optimal cluster number as 7. (B) K-means cluster analysis of the 407 CRC samples based on their Euclidean distance calculated through β values of the 3,561 CpG sites with the cluster number specified as 7. (C) Kaplan-Meier curves of CRC samples stratified by their cluster. (D) Kaplan-Meier curves of CRC samples in cluster 4 (CIMP group) and other clusters (noCIMP). Abbreviations: CRC, colorectal cancer; CRMP, CpG island methylator phenotype (CIMP).

