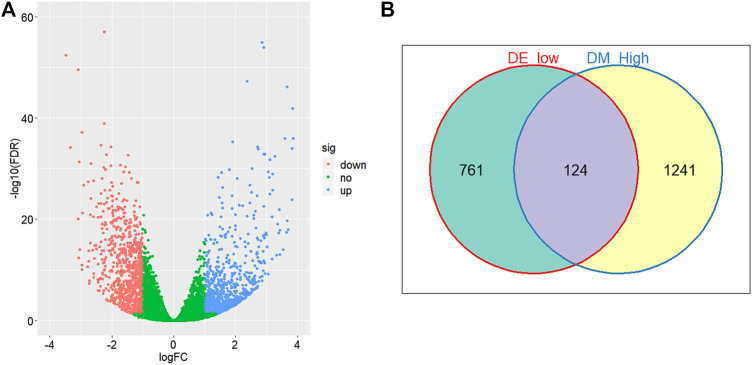
FIGURE 3.
Differential methylation and expression analysis. (A) Volcano plot of logarithmic-transformed FDR (Y-axis) vs. logarithmic-transformed fold change of gene expression values (X-axis). Red, blue, and green dots represent downregulated, upregulated, and non-differential expression genes in CRC samples, respectively. (B) Venn diagram of hyper-methylation and downregulated expression genes in CRC samples. Hyper-methylation genes are defined as genes containing at least one hyper-methylation CpG site.

