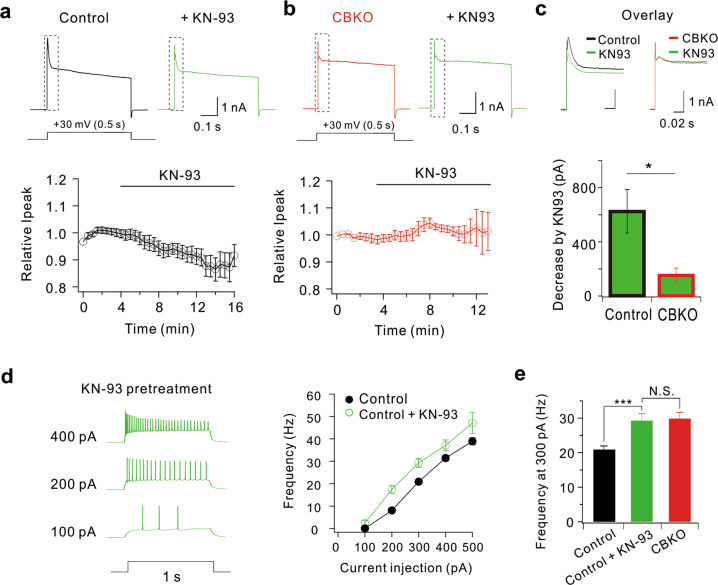
Fig. 6. KN-93 decreases K+ currents in control GCs but not in CBKO GCs.
a Representative whole-cell K+ currents at + 30 mV in control GCs before (black) and after KN-93 application (green). Changes in K+ current amplitude after KN-93 application were averaged from seven cells, and the mean ± SEM was plotted (lower panel). b Representative whole-cell K+ currents at +30 mV in CBKO GCs before (red) and after KN-93 application (green). Changes in K+ current amplitude after KN-93 application were averaged from seven cells, and the mean ± SEM was plotted (lower panel). c Representative whole-cell K+ currents at +30 mV shown in (a, b) with dotted boxes are overlaid on an expanded time scale. Bar graphs indicate decreases in Ipeak by KN-93 (lower panel). Mean ± SEM. d Representative AP traces induced by injecting depolarizing currents as indicated by the number left to the traces in control GCs pretreated with KN-93 (left) and the corresponding F–I curve (green circles, right). The F–I curve from control GCs shown in Fig. 1b was superimposed for comparison (black line). e The firing frequency obtained by 200 pA current injection obtained in the presence of KN-93 in control GCs (green, n = 7) was compared with that in the control (black), as shown in Fig. 1b. Data are represented as the mean ± SEM. ***P < 0.001. N.S. not significant by Student’s t test.

