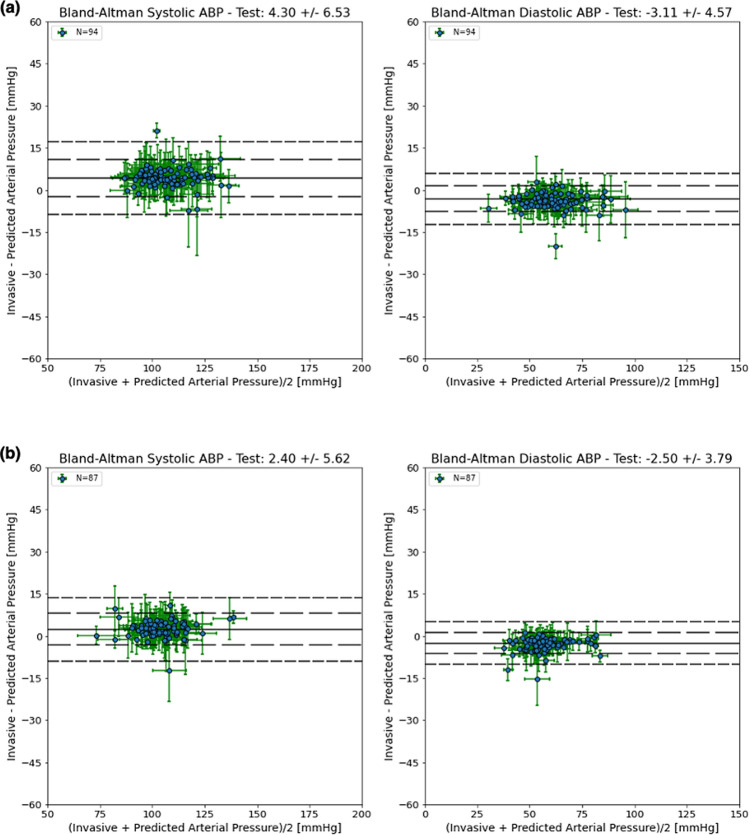
Figure 3.
Bland–Altman plots for the MIMIC and UCLA ICU test cohorts. Systolic BP measurements per patient (left), and Diastolic BP measurements per patient (right) using a thirty-two second window; horizontal error bars represent the standard deviation of the blood pressure values, vertical error bars represent the standard deviation of the differences; solid lines indicate the mean difference values, dashed lines indicate the mean difference values +/− 1 and 2 times the standard deviation of the differences. Results for MIMIC are shown in (a), and UCLA in (b).

