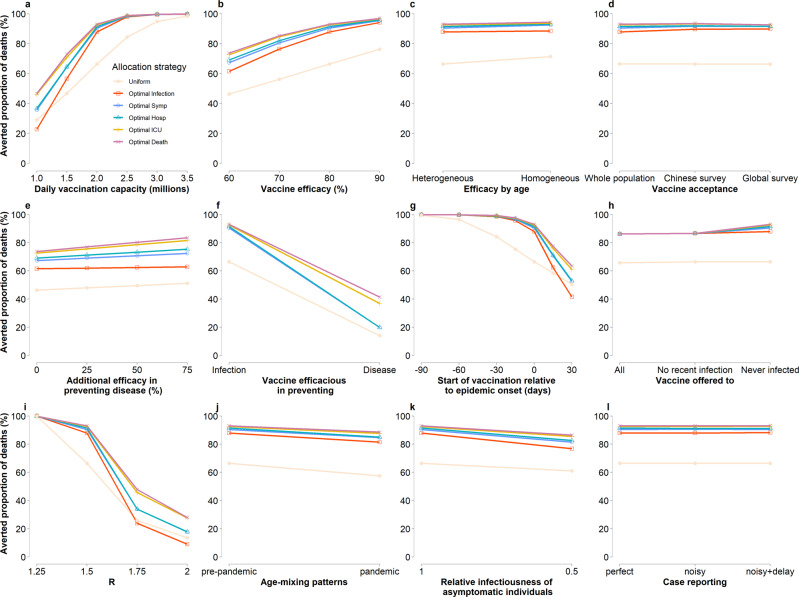
Fig. 3. Effectiveness of alternative vaccination strategies under alternative assumptions.
a Averted proportion of deaths for different strategies (uniform vaccination and the five optimal strategies) as compared to no vaccination for different values of the vaccination capacity. b As (a), but for different values of the vaccine efficacy. c As (a), but assuming vaccine efficacy to be heterogeneous by age (“Heterogeneous”, as in the main analysis) or homogeneous (“Homogeneous”) at 80% across age groups. d As (a), but considering possible vaccine hesitancy. In particular, we consider three alternative scenarios: (i) “Whole population”, i.e., all individuals are willing to accept the vaccine; (ii) “Chinese survey”, i.e., on average 83% of the population is willing to accept the vaccine as estimated in a survey conducted on the Chinese population (age-specific estimates reported in Supplementary Table 2); (iii) “Global survey”, i.e., on average 61% of the population is willing to accept the vaccine as estimated in a survey at the global level41. e As (a), but assuming that the vaccine has 60% efficacy in preventing the infection and 0%, 25%, 50%, or 75% efficacy in preventing the disease given the infection. f As (a), but without the strategy minimizing the incidence of infections and for different vaccines actions, (i) “Infection”, i.e., 80% efficacy in preventing infections as in the main analysis, and (ii) “Disease”, i.e., 80% efficacy in preventing disease and 0% efficacy in preventing infections. g As (a), the vaccination campaign starts between 90 days before and 30 days after the epidemic onset. h As (a), but the vaccine is administered to (i) all individuals regardless of their history of infection (“All”); (ii) only to individuals who were not infected in the previous 6 months (“No recent infection”); and (iii) only to individuals who were never infected (“Never infected”). i As (a), but for different values of the reproduction number. j As (a), but using “pre-pandemic” age-mixing patterns (as in the baseline analysis) or “pandemic” mixing patterns. k As (a), but assuming that the infectiousness of asymptomatic individuals relative to symptomatic individuals is 1 (as in the baseline) or 0.5. l As (a), but we consider the reporting of cases to be: (i) perfect (“perfect”, as in the baseline analysis); (ii) subject to noise (“noisy”); or subject to noise and an 11-day delay (“noisy+delay”). Results for other risk metrics are similar and displayed in Supplementary Figs. 8–11. Keys and labels apply to all panels. “Optimal Symp” and “Optimal Hosp” represent the two optimal strategies for minimizing symptomatic cases and hospitalizations respectively.

