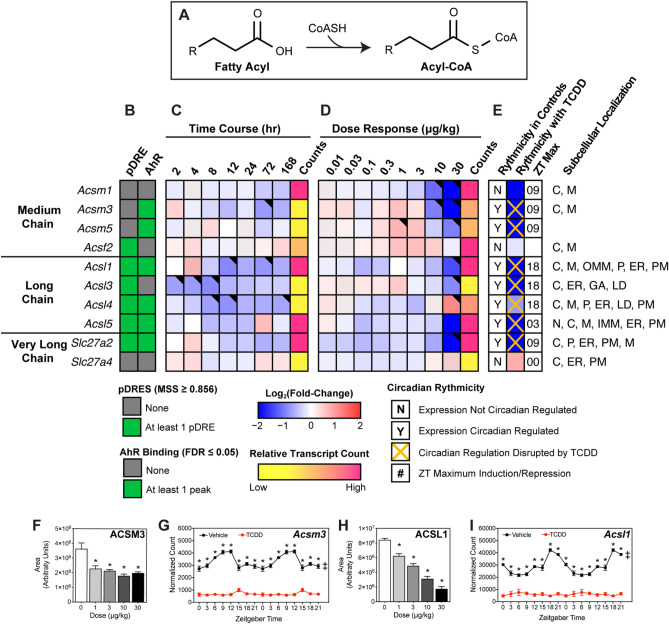
Figure 3.
Effect of TCDD on hepatic fatty acid activation. Differential expression of genes associated with fatty acid activation assessed using RNA-seq. (A) Fatty acid activation reaction catalyzed via acyl-CoA synthetases. Official gene symbol designated in the MGI database are listed. (B) The presence of putative dioxin response elements (pDREs) and AhR enrichment at 2 h. (C) Time-dependent gene expression was assessed following a single bolus dose of 30 μg/kg TCDD (n = 3). (D) Dose-dependent gene expression following oral gavaged every 4 days for 28 days with 0.01, 0.03, 0.1, 0.3, 1, 3, 10 or 30 μg/kg TCDD (n = 3). (E) Circadian regulated genes are denoted with a “Y”. An orange ‘X’ indicates abolished diurnal rhythm following oral gavage with 30 μg/kg TCDD every 4 days for 28 days. ZT indicates statistically significant (P1(t) > 0.8) time of maximum gene induction/repression. Counts represent the maximum number of raw aligned reads for any treatment group. Low counts (< 500 reads) are denoted in yellow with high counts (> 10,000) in pink. Differential expression with a posterior probability (P1(t)) > 0.80 is indicated with a black triangle in the top right tile corner. Protein subcellular locations were obtained from COMPARTMENTS and abbreviated as: cytosol (C), endoplasmic reticulum (ER), Golgi apparatus (GA), lipid droplet (LD), lysosome (L), mitochondrion (M), outer mitochondrial membrane (OMM), inner mitochondrial membrane (IMM), nucleus (N), peroxisome (P), and plasma membrane (PM). Capillary electrophoresis was used to assess (F) ACSM3 and (H) ACSL1 protein levels in total lysate prepared from liver samples harvested between ZT0-3 (n = 3). Bar graphs denote the mean ± SEM. Statistical significance (*p ≤ 0.05) was determined using a one-way ANOVA followed by Dunnett’s post-hoc analysis. Diurnal expression of (G) Acsm3 and (I) Acsl1 was assessed by RNA-seq (n = 3). Asterisks denotes a posterior probability (P1(t) > 0.8) within the same timepoint comparing vehicle to TCDD. Diurnal rhythmicity (‡) was determined using JTK_CYCLE for each treatment. Circadian data are plotted twice along the x-axis to better visualize the gene expression rhythmicity. The heatmap was created using R (v4.0.4). Plots were created using GraphPad Prism (v8.4.3). The biochemical reaction was created using Adobe Illustrator (v25.2).

