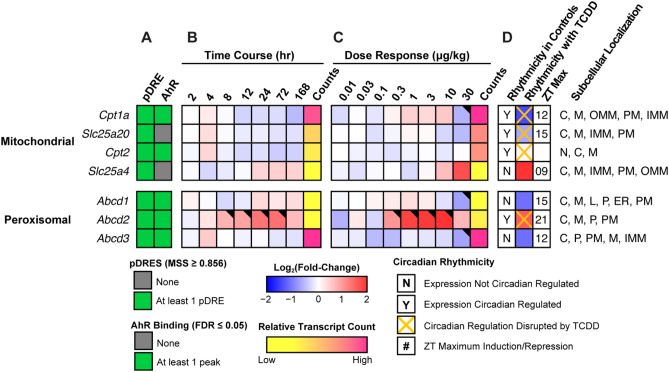
Figure 4.
Mitochondrial and peroxisomal free fatty acid and acyl-CoA transport. Differential expression of genes associated with fatty acid transport assessed by RNA-seq. Mouse Genome Informatics (MGI) official gene symbols are used. (A) The presence of putative dioxin response elements (pDREs) and AHR genomic binding at 2 h. (B) Time-dependent expression following a single bolus dose of 30 μg/kg TCDD (n = 3). (C) Dose-dependent gene expression assessed following oral gavage every 4 days for 28 days with TCDD (n = 3). (D) Diurnal regulated gene expression denoted with a “Y”. An orange ‘X’ indicates abolished diurnal rhythm following oral gavage with 30 μg/kg TCDD every 4 days for 28 days. ZT indicates statistically significant (P1(t) > 0.8) time of maximum gene induction/repression. Counts represent the maximum number of raw aligned reads for any treatment group. Low counts (< 500 reads) are denoted in yellow with high counts (> 10,000) in pink. Differential gene expression with a posterior probability (P1(t)) > 0.80 is indicated by a black triangle in the top right tile corner. Protein subcellular locations were obtained from COMPARTMENTS and abbreviated as: cytosol (C), endoplasmic reticulum (ER), lysosome (L), mitochondrion (M), outer mitochondrial membrane (OMM), inner mitochondrial membrane (IMM), nucleus (N), peroxisome (P), and plasma membrane (PM). The heatmap was created using R (v4.0.4).

