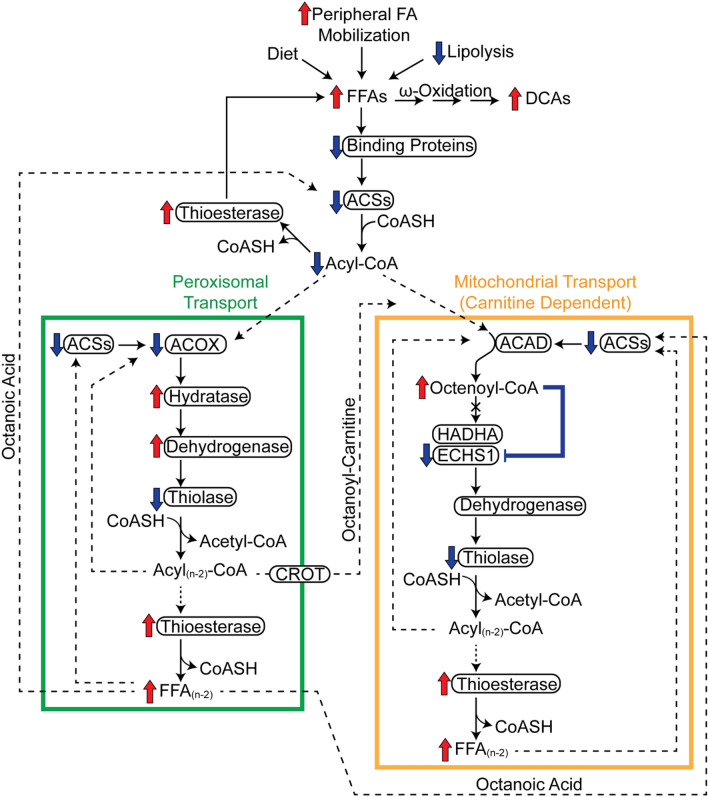
Figure 9.
Summary of the effects of TCDD on fatty acid oxidation. Inhibition of β-oxidation in TCDD-induced hepatic steatosis involves the (i) repression of FA binding proteins, (ii) repression of FA activation, and (iii) induction of thioesterase activity. Acyl-CoA synthetase repression reduces activated FAs available for β-oxidation while the repression of binding proteins increases acyl-CoA susceptibility to hydrolysis by induced thioesterases. VLCFAs and LCFAs were partially metabolized in peroxisomal β-oxidation (green box) to medium-length chain FAs (MCFAs) due to peroxisomal specific thioesterase activity which deactivates acyl-CoAs. Peroxisomal CROT transports MCFAs out of peroxisomes to the mitochondria (orange box). MCFAs, such as octanoic acid, could also diffuse out of peroxisomes and into mitochondria where they undergo oxidation following activation by acyl-CoA synthetases. In the canonical pathway, acyl-CoAs are first oxidized by acyl-CoA dehydrogenases that were minimally affected by TCDD. Two enzymes catalyze the subsequent step of mitochondrial β-oxidation; HADHA (which prefers long chain acyl-CoAs) and ECHS1 which prefers short and medium chain acyl-CoAs. Peroxisomal and mitochondrial medium chain acyl-CoA species would accumulate, specifically octenoyl-CoA, due to substrate overload and inhibition of ECHS1 activity by accumulating octenoyl-CoA levels. Octenoyl-CoA accumulation also sequesters free CoASH inhibiting other CoASH-dependent reactions including the thiolytic cleavage of the ketoacyl-CoA into acetyl-CoA and an acyl-CoA that is 2 carbons shorter. Therefore, TCDD dose-dependently induced a futile cycle of FA activation and acyl-CoA hydrolysis leading to octenoyl-CoA accumulation that inhibits ECHS1 activity and depletes free coenzyme A required by enzymes in other pathways leading to the inhibition of β-oxidation and energy depletion. With β-oxidation impaired, accumulating FFAs undergo ω-oxidation leading to increases in DCAs. Proteins are denoted with an oval. Red arrows indicate induction and blue arrows indicate repression. Solid lines denote reactions while dashed lines denote substrate trafficking. The figure was created using Adobe Illustrator (v25.2).

