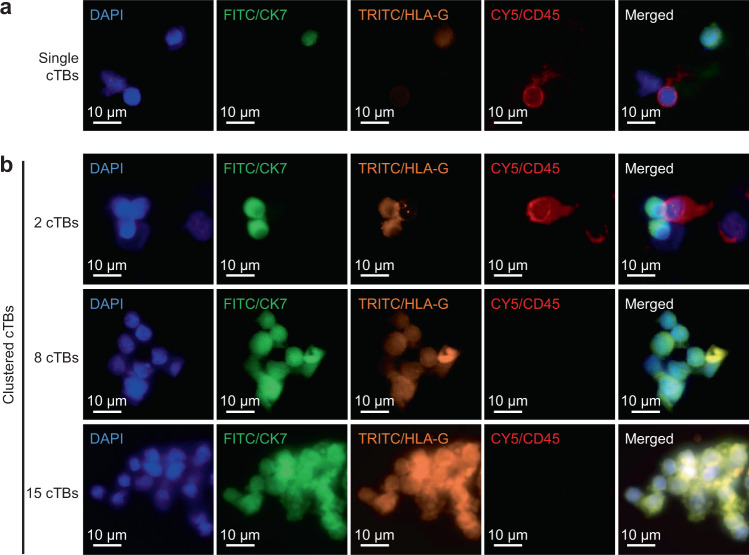
Fig. 4. Characterization and enumeration of single and clustered cTBs isolated from blood samples collected from pregnant women.
Representative immunofluorescent images of a single and b clustered cTBs in different sizes of cTB-clusters shown at ×40 magnification. Blue: DAPI stained nuclei; green: FITC stained CK7; orange: TRITC stained HLA-G; red: CY5 stained CD45. Scale bar, 10 µm. Data are representatives of four independent assays.

