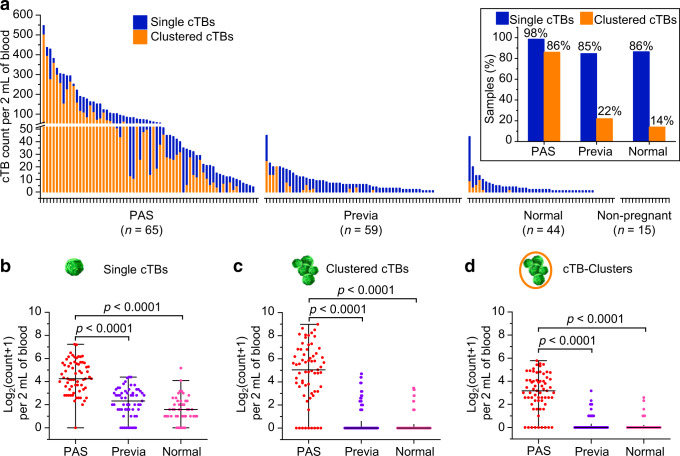
Fig. 5. Comparison of single and clustered cTBs, as well as cTB-clusters in PAS, placenta previa, and normal placentation.
a Counts of single and clustered cTBs per 2 mL of blood for all participants enrolled in the study (n = 183). Pregnant women (n = 168) are divided into three groups (i.e., PAS, placenta previa, and normal placentation) based on clinical diagnosis and sorted within groups based on total cTB count (single cTB count plus clustered cTB count). Non-pregnant indicates the control cohort of healthy non-pregnant female donors (n = 15). The inset shows the percentages of pregnant women with detectable single and clustered cTBs in PAS, placenta previa, and normal placentation. Counts of: b single cTBs, c clustered cTBs, and d cTB-clusters per 2 mL of blood for pregnant women with PAS (n = 65), placenta previa (n = 59), and normal placentation (n = 44) are shown. Counts are log2-transformed. The two shorter horizontal lines denote the 25–75% interquartile ranges (IQR) and the longer horizontal lines in between denote the median. Data are expressed as mean ± SE for b single cTBs: PAS (4.4 ± 0.2), placenta previa (2.2 ± 0.2), normal placentation (1.6 ± 0.2); c clustered cTBs: PAS (4.7 ± 0.3), placenta previa (0.6 ± 0.2), normal placentation (0.3 ± 0.1); and d cTB-clusters: PAS (3.0 ± 0.2), placenta previa (0.3 ± 0.1), normal placentation (0.2 ± 0.1). Significant differences between different groups are evaluated using one-way ANOVA with Bonferroni’s multiple comparisons test (two-sided with adjustment). The p values for b single cTBs, c clustered cTBs, and d cTB-clusters (PAS versus previa; PAS versus normal)) are all <0.0001. Source data are provided in the Source data file.

