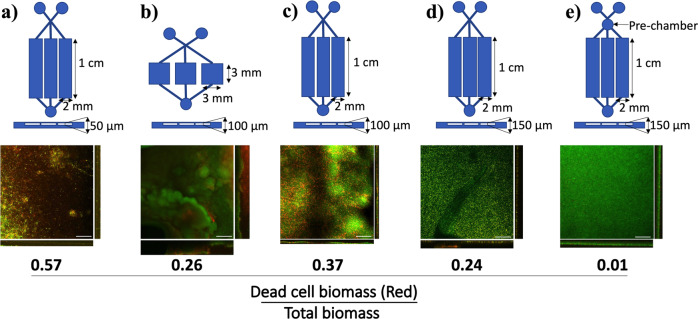
Fig. 2. BiofilmChip dimensions, geometry and functional characterization.
schematic representations of the different manufactured chip geometries. The P. aeruginosa PAO1 biofilm structure formed in each chip is shown in the confocal microscopy images (sum and orthogonal views). In all cases, the biofilm was grown for 72 h and stained with the LIVE/DEAD BacLight Bacterial Viability Kit. At the bottom of the images, average proportion of dead cells (stained in red) in the total biofilm biomass from three different experiments is shown. Scale bar represents 50 μm.

