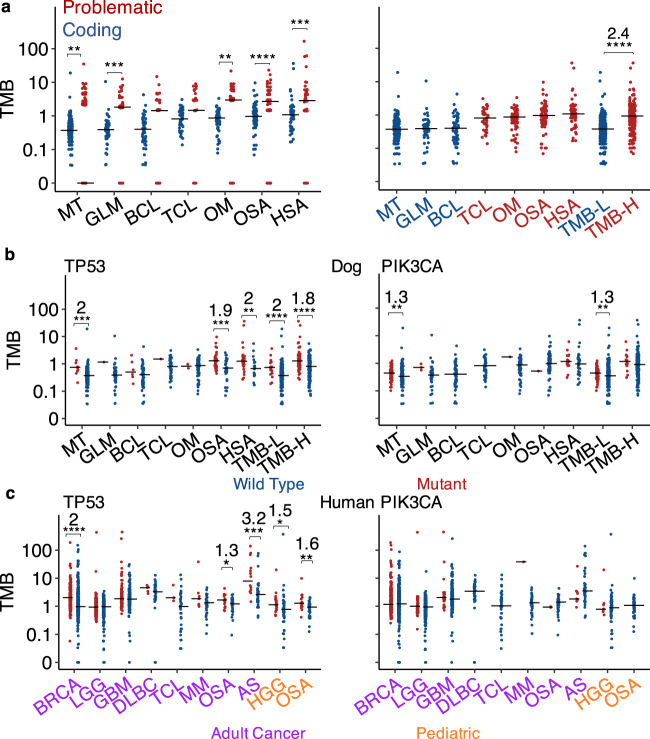
Fig. 6. TMB varies among tumor types and is correlated with TP53 mutation.
a TMB distributions of each canine tumor type ordered left to right from lowest to highest median values. The left plot shows that problematic genes (see “Methods”) have significantly higher TMB than other genes, and thus were excluded from further analyses. The right plot indicates that canine tumors are classified into TMB-low (TMB-L) and -high (TMB-H). Two-sided Wilcoxon tests were conducted to examine the TMB difference between two groups indicated, with **, ***, **, ****, ***, and **** from left to right representing unadjusted p = 0.006, 0.0006, 0.001, 4.7e−6, 0.0003 and 2e−16, respectively. For significant comparisons, the fold change in median TMB is also indicated. n = 202, 49, 55, 38, 71, 78, 49, 306 and 236 independent tumors for each tumor type listed from left to right, respectively. b, c TMB distributions of cases with wild type (blue) or mutant (red) TP53 or PIK3CA within each canine (b) or human (c) tumor type. For tumor types with both wild type and mutant groups having ≥5 tumors, two-sided Wilcoxon tests were conducted to determine the significance of the association between TMB and TP53 or PI3KCA, with unadjusted p-values and fold changes shown as described in (a). LGG low-grade glioma, GBM glioblastoma, HGG high-grade glioma. From left to right: b n = 11, 191, 1, 49, 6, 49, 1, 37, 2, 69, 40, 38, 29, 20, 18, 288, 72 and 164 independent tumors for TP53 (***, ***, **, ****, and **** representing p = 0.0002, 0.0003, 0.005, 2.4e−7 and 9.9e−5, respectively), while n = 74, 128, 3, 46, 55, 38, 1, 70, 1, 77, 15, 34, 77, 229, 17 and 219 independent tumors for PIK3CA (** and ** representing p = 0.005 and 0.007, respectively). c n = 345, 703, 249, 265, 121, 268, 5, 36, 4, 38, 7, 39, 20, 29, 14, 34, 22, 44, 19 and 37 independent tumors for TP53 (****, *, ***, *, and ** representing p = 2e−16, 0.02, 0.0006, 0.02 and 0.008, respectively), while n = 347, 701, 42, 472, 36, 353, 41, 42, 1, 45, 2, 47, 10, 38, 8, 58 and 56 independent tumors for PIK3CA. Source data are provided as a Source Data file.

