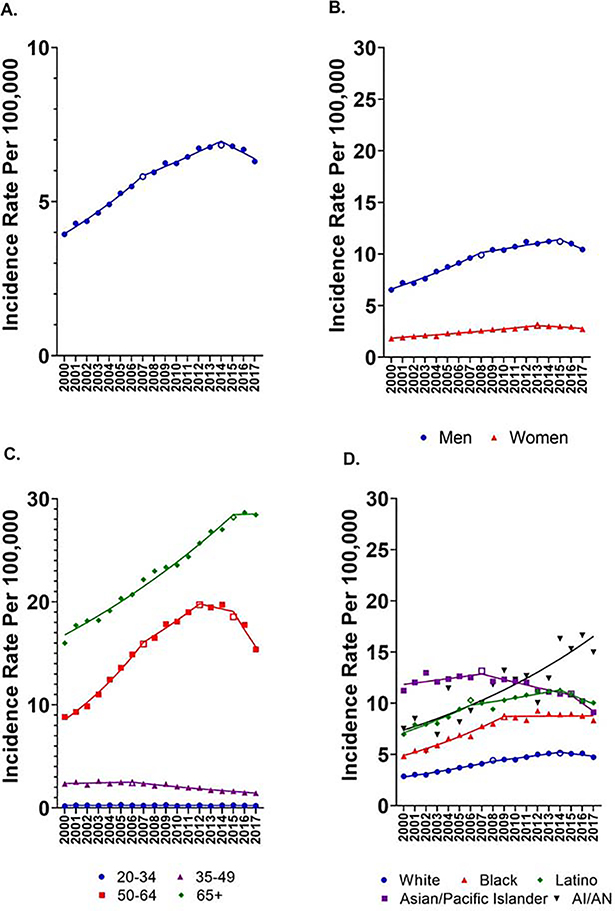
Figure 1:
Age-standardized hepatocellular carcinoma incidence rates, 2000–2017 A) overall, B) by sex, C) by age and D) by race/ethnicity. Symbols indicate incidence rates, lines represent trends between joinpoints, and open symbols represent joinponts. AI/AN: American Indian and Alaska Natives. Note that the scale in panel A differs from the other panels.

