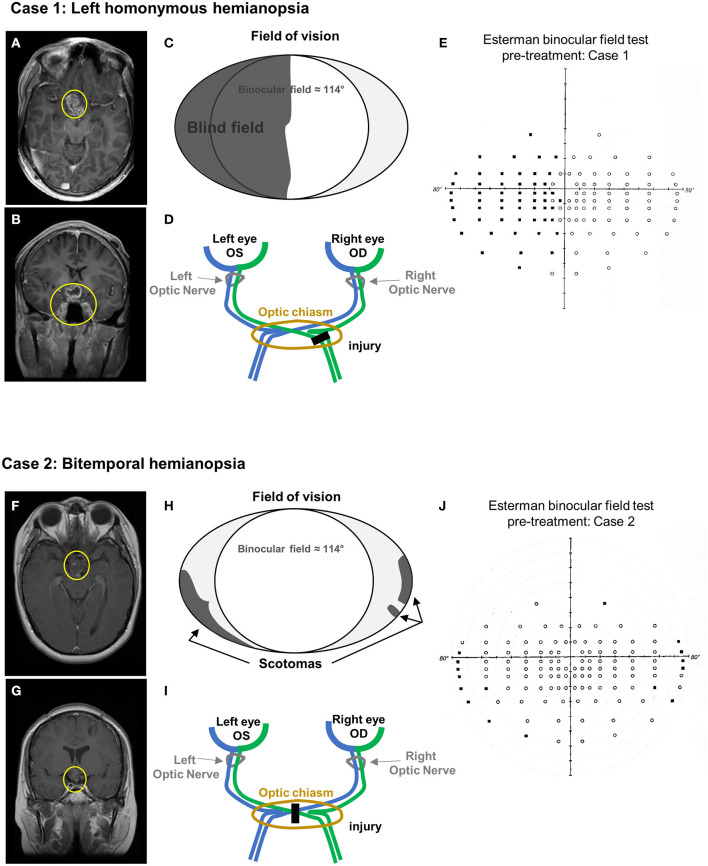
Figure 1.
Case presentation. (A–E) Case 1 MRI axial (A) and coronal (B) view (T1 + contrast). Yellow circles indicate the remaining tumor mass after chemotherapy. (C) Schematic of the visual field defects. (D) Diagram of the optic pathway indicating the location of the injury. (E) Esterman binocular field test at baseline (pre-treatment). Black dots correspond to unseen point of light. (F–J) Case 2 MRI axial (F) and coronal (G) view (T1 + contrast). Yellow circles indicate the remaining tumor mass after chemo- and focal radiotherapy. (H) Schematic of the visual field defects. (I) Diagram of the optic pathway indicating the location of the injury. (J) Esterman binocular field test at baseline (pre-treatment). Black dots correspond to unseen point of light.

