Figure 3.
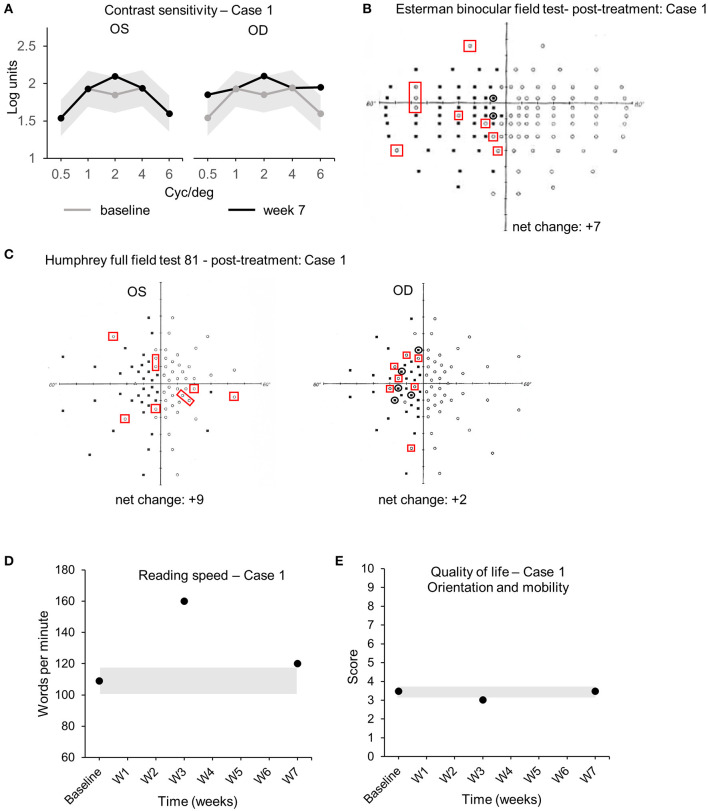
Case 1—Visual outcome measures. (A) Contrast sensitivity at baseline (gray line) and at the end of the treatment (week 7—black line) in the left (OS) and the right (OD) eye. (B) Esterman binocular field test post-treatment (week 7). Red squares indicate newly acquired points, black circles indicate lost points, compared to baseline. (C) Monocular Humphrey full-field test (81 points) post-treatment (week 7) in the left (OS) and right (OD) eye. Red squares indicate newly acquired points, and black circles indicate lost points, compared to baseline. (D) Reading speed at baseline, week 3, and post-treatment (week 7). (E) Quality of life scores at baseline, week 3, and post-treatment (week 7). Gray shaded areas in (A,D,E) indicate the values of the coefficient of repeatability (±COR). OD, oculus dexter; OS, oculus sinister; W, week.

