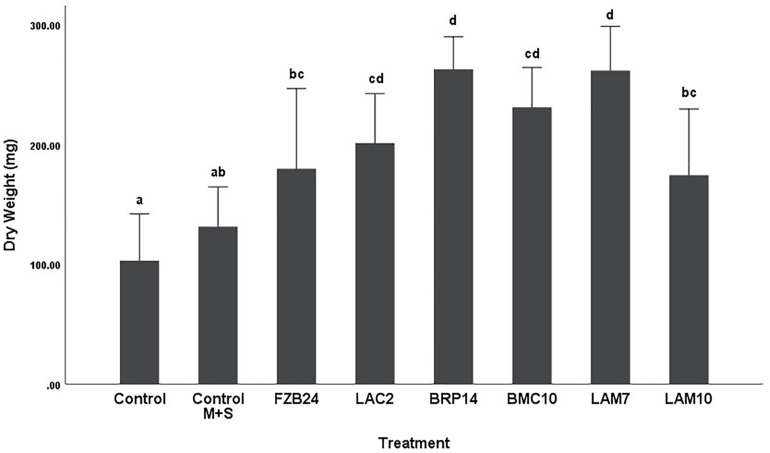
FIGURE 3.
Growth response of plants exposed to BVCs from isolates growing on solid M+S media. Dry weight of plants is measured in (mg), error bars represent confidence interval of the mean 99% (n = 8). Isolates which share a common letter are not significantly different to one another (p > 0.01) according to one-way between groups ANOVA with post hoc Tukey test.

