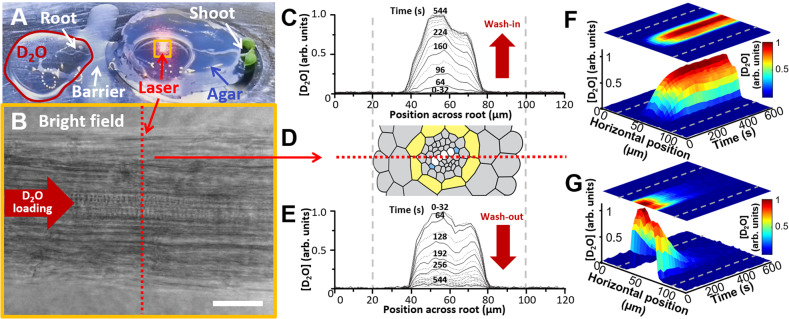
Fig. 1. Overview of the water imaging system and its outputs in line-scan mode.
A Experimental setup for imaging hydrodynamics, showing A. thaliana under Raman measurement (laser). D2O loaded via the intact root tip is separated from the rest of the plant by a silicone grease barrier. The H2O-containing agar cap placed over the root prevents movement and desiccation. The location of panel B is indicated by the orange box. B Bright-field micrograph of intact root (scale bar 25 µm). The dotted red line indicates the location of line scans in (C–G). Note the visible xylems in this central plane of focus. C Time-course of D2O wash-in during successive line scans across the root center. Timings (in seconds) define the start of each line scan. D Root anatomy, showing the location of the confocal RMS line scan (C, E) across the full diameter, through the slightly tilted stele, with highlighted endodermis (yellow), protoxylem vessels (blue), and immature xylem (white). Spatial resolution is diffraction-limited at a 2 µm step size, temporal resolution is 300 ms/point (detector limit). E Time-course of D2O wash-out during successive line scans. Timings (in seconds) define the start of each line scan. F 3D plot showing spatiotemporal dynamics of D2O pulse arrival at the line under observation. G 3D plot showing spatiotemporal dynamics of D2O washing out of the preparation when H2O is re-introduced via the intact root. Spatial resolution is diffraction-limited at a 2 µm step size. Temporal resolution is 300 ms/point (detector limit). Dotted gray lines in C–G indicate the outer boundary of the root under observation. Source data underlying Fig. 1C, E–G are provided as a Source Data file.

