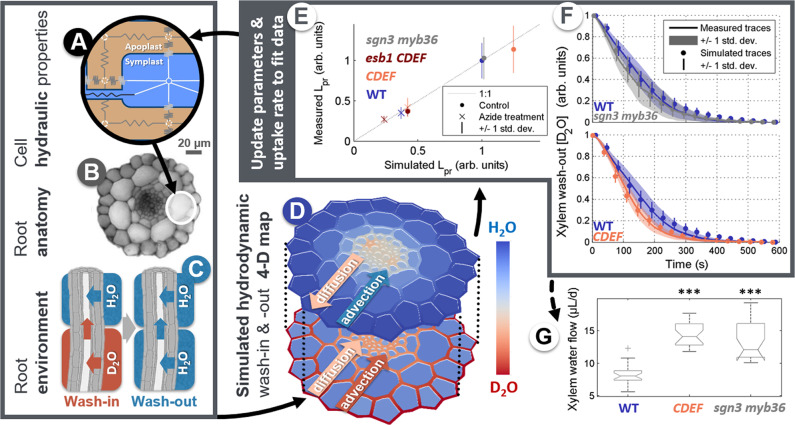
Fig. 2. Scheme of the inverse modeling loop used to extract quantitative xylem water flow rate data from RMS D2O wash-out traces.
A Scheme of the subcellular compartments and pathways of the hydraulic model MECHA. B A. thaliana root anatomy used in the model. C Scheme of D2O wash-in and wash-out conditions. D Snapshot of a simulated D2O map for a mutant with no Casparian strip during the wash-in phase. E Fit of measured and simulated root hydraulic conductivities used to constrain the cell hydraulic parameters (WT: N = 15; CDEF: N = 12; esb1 CDEF: N = 10; sgn3 myb36: N = 10 independent plants; vertical bars show the extent of one standard deviation on both sides of the mean values). F Fit of measured and simulated D2O wash-out traces (WT: N = 24; CDEF: N = 18; sgn3 myb36: N = 9 independent plants; vertical bars and shaded areas show the extent of one standard deviation on both sides of the mean values). G Retrieved xylem water flow rates (WT: N = 24; CDEF: N = 18; sgn3 myb36: N = 9 independent plants; boxplots show 25th, 50th, and 75th percentiles, whiskers the most extreme points excluding outliers “+”). Triple stars indicate Anova-1 p-values below 0.001. Source data underlying Fig. 2E–G are provided as a Source Data file.

