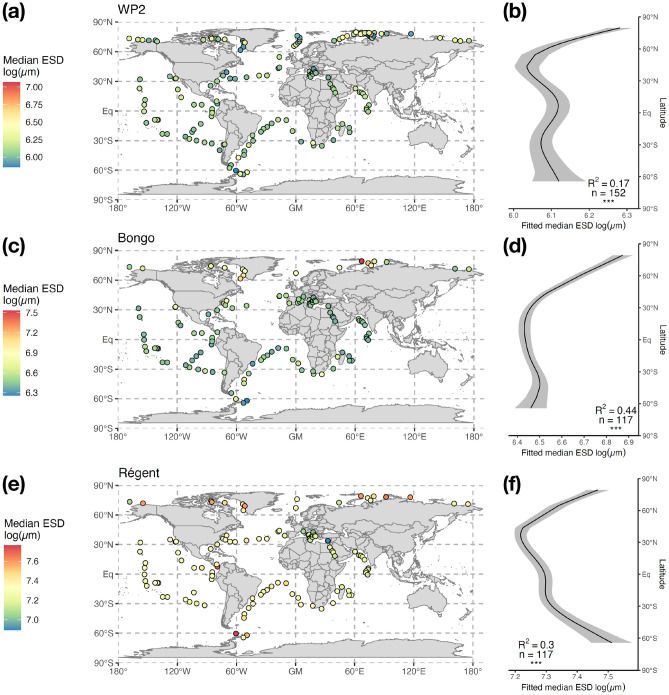
Figure 3.
Maps and latitudinal patterns of the logged median Equivalent Spherical Diameter (ESD, µm) observed for Copepoda based on (a,b) WP2 samples (200 µm mesh), (c,d) Bongo samples (300 µm mesh) and (e,f) Régent samples (680 µm mesh). The major and minor axes of the best fitting ellipses were measured for each organism to estimate their ESD. Community-level size structure was determined through the median value of the ESD distribution at individual-level. The solid curves in the right-hand side plots illustrate the prediction from the Generalized Additive Model (GAM) fitting median ESD as a function of latitude. The explanatory power of the GAM (adjusted R2), the number of samples used and the significance of the smooth term (p < 0.001 = ***, p < 0.01 = ***, p < 0.05 = *, p > 0.05 = ns) are reported on the plots. The grey ribbon illustrates the standard error of the prediction. Only the stations where ESD was measured for at least 20 individuals were considered.

