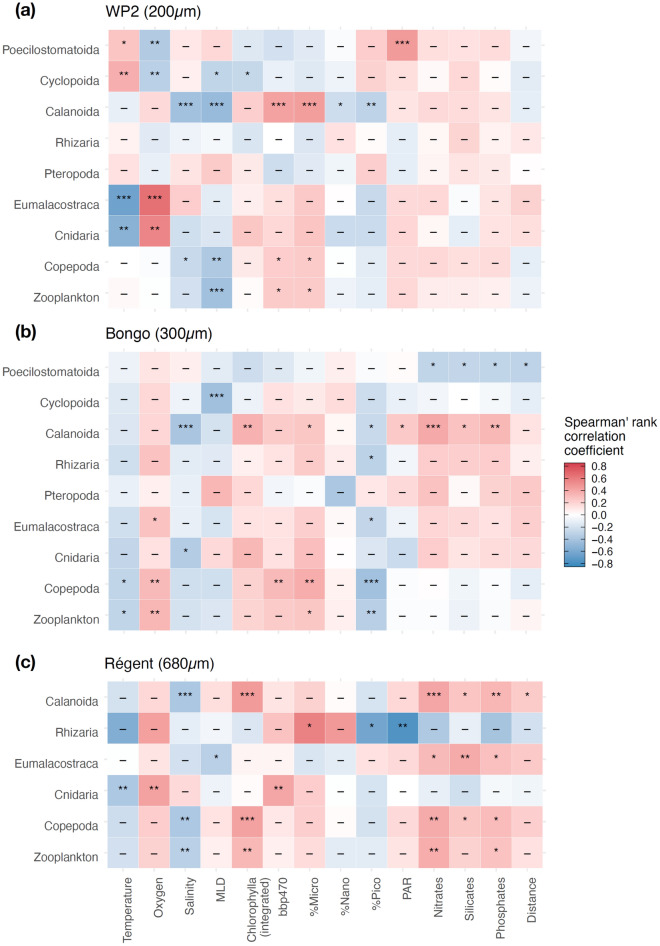
Figure 4.
Heatmaps of the Spearman’s rank correlation coefficients computed between the size structure (i.e., logged median Equivalent Spherical Diameter; ESD) of the main zooplankton groups and the selected 14 covariates depicting the environmental conditions in the global surface ocean as sampled by (a) WP2 net (200 µm mesh), (b) Bongo net (300 µm mesh) and (c) Régent net (680 µm). The significance of the Spearman’s rank correlation tests are reported in the tiles (p < 0.001 = ***, p < 0.01 = ***, p < 0.05 = *, p > 0.05 = ns). Only the zooplankton groups displaying significant correlation coefficients for more than one environmental covariate in at least one net parameter are shown (see Supplementary Fig. S8 for all groups). Only the stations where ESD was measured for at least 20 individuals of a group were considered when computing the correlation coefficients. Distance stands for distance to coast (in km).

