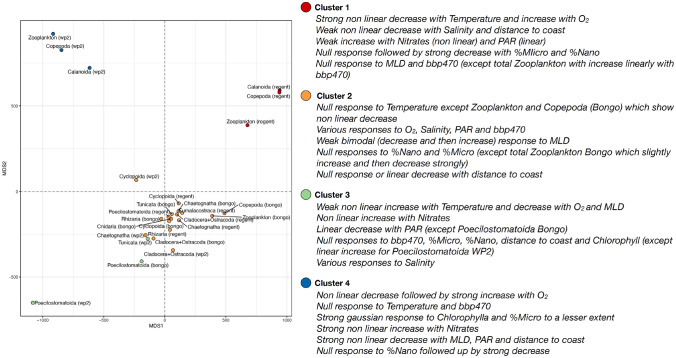
Figure 6.
Two dimensional metric dimensional scaling (MDS) plot illustrating the similarity between the responses of the groups’ abundances to the environmental covariates selected. The smoothing curves from the Generalized Additive Models (GAMs) modelling the global gradients in cubic-transformed abundances (ind m3) of the zooplankton groups (estimated for various plankton nets) as a function of ten environmental covariates and displaying a deviance explained > 40%. Smoothing curves span a 1–100 scale spanning the range of the covariates measured values. The smoothing curves were combined into a multivariate data series to compute Dynamic Time Warping (DTW) distances and perform partitioning around medoids (PAM) clustering. This way the GAMs were clustered into four clusters that represent combinations of zooplankton groups and plankton nets that exhibit similar abundance-covariate relationships.

