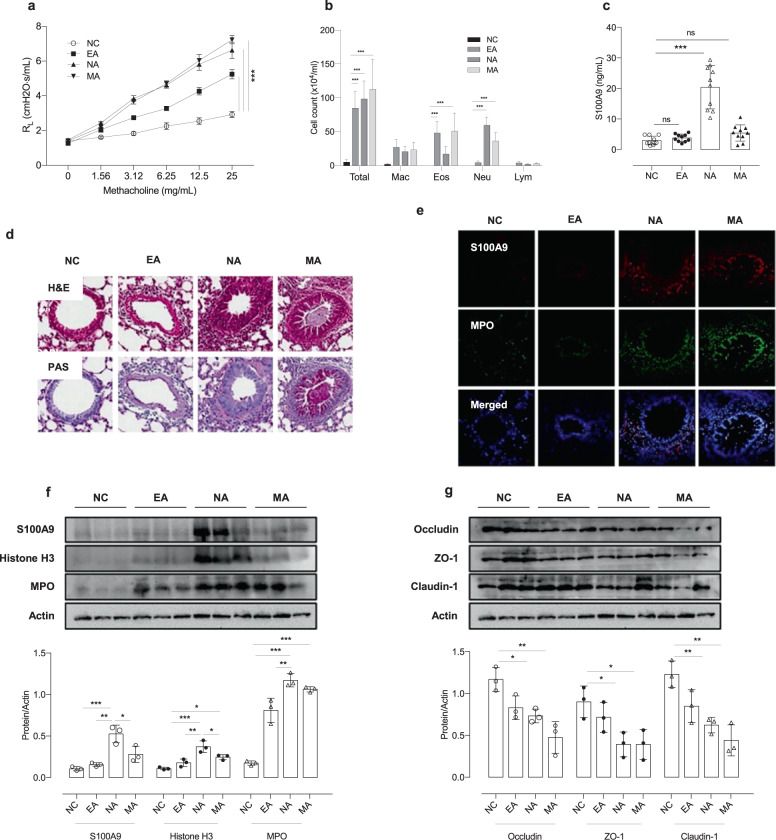
Fig. 5. LPS-induced S100A9 and neutrophil activation in vivo.
a Airway hyperresponsiveness. b Differential cell counts. c Levels of S100A9 in BALF. d Lung tissues stained with H&E (upper panel) or PAS (lower panel). Scale bar, 200 μm. e Immunofluorescent staining for S100A9 (red) and myeloperoxidase (green) in lung tissues. Scale bar, 25 µm. f The expression of S100A9, histone H3 and MPO in lung tissues. g Changes in the expression of tight junction proteins in lung tissues. The data are presented as the means ± SD. *P < 0.050, **P < 0.010, ***P < 0.001 were obtained by one‐way ANOVA with Bonferroni’s post hoc test. EA eosinophilic asthma, Eos eosinophil, IL interleukin, LPS lipopolysaccharide, Lym lymphocytes, MA mixed granulocytic asthma, Mac macrophage, MPO myeloperoxidase, NA neutrophilic asthma, NC normal control, NE neutrophil elastase, Neu neutrophil, S100A9, S100 calcium-binding protein A9.

