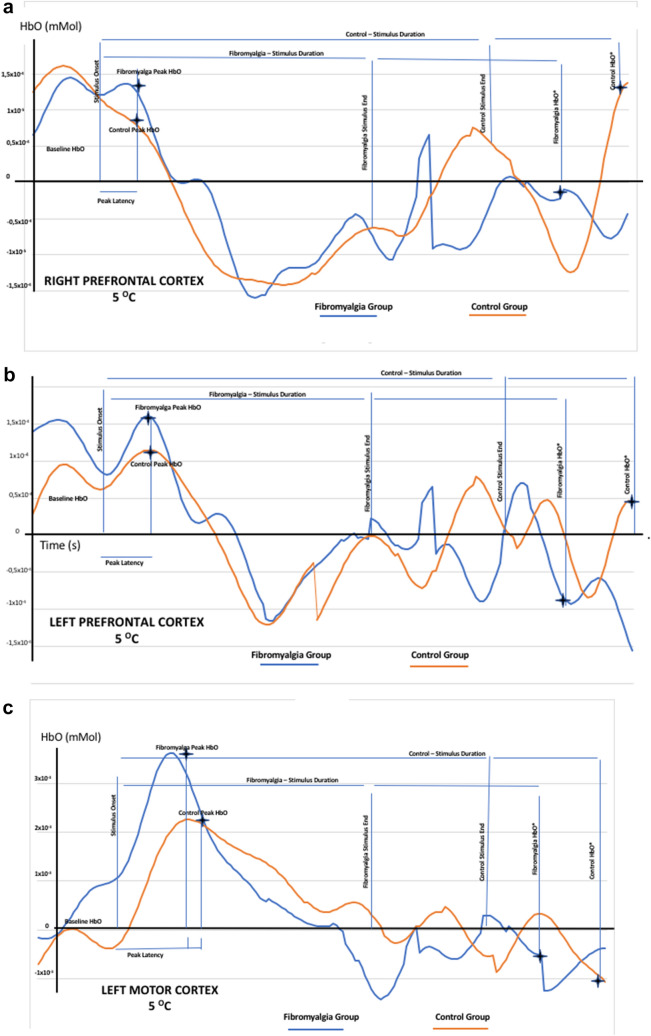
Figure 3.
Representative waveforms from cortical activation at right PFC (A); left PFC (B) and left motor cortex (C). Figures shows waveforms from cortical activation of an illustrative subject with fibromyalgia or one control. They showed waveforms of oxyhemoglobin (HbO) by fNIRS upon to primary (25 °C) or secondary (5 °C) stimulus. The figure presents both sides left and right prefrontal cortex (PFC). (A) Peak latency represents the maximum peak (time in seconds) and HbO millimolar. (B) (ΔHbO) [steady-state HbO before thermal primary or secondary stimuli onset minus the absolute value of peak HbO] (mM). (C) The cortical activation 15 s after thermal stimuli end by the variability of absolute HbO concentration [the difference between the delta value of HbO (Δ-HbO) 15 s from thermal stimuli end and Δ-HbO before thermal stimuli onset (Δ-HbO*)].

