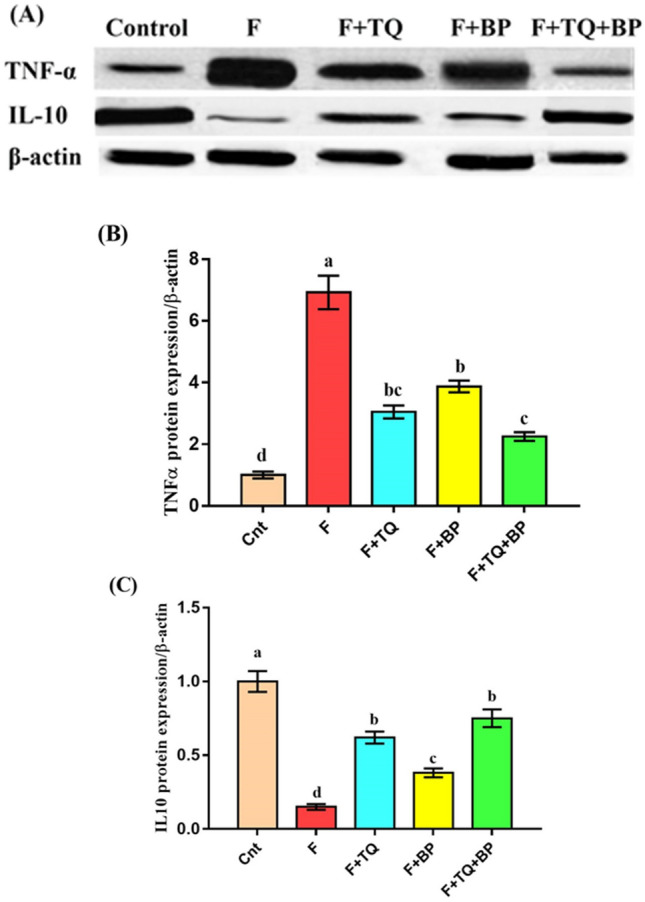
Figure 5.

Western blot analysis shows changes in TNFα and IL10 protein expression relative to β-actin protein (control). (A) TNFα and IL10 protein bands. (B and C) Band quantification of TNFα and IL10 protein (ImageJ, https://imagej.nih.gov/ij/index.html). Data presented as fold change (mean) ± SEM (n = 7/group). Columns carrying different letters [a (the highest value) – d (the lowest value)] are significantly different at p < 0.05. All groups were compared to each other.
