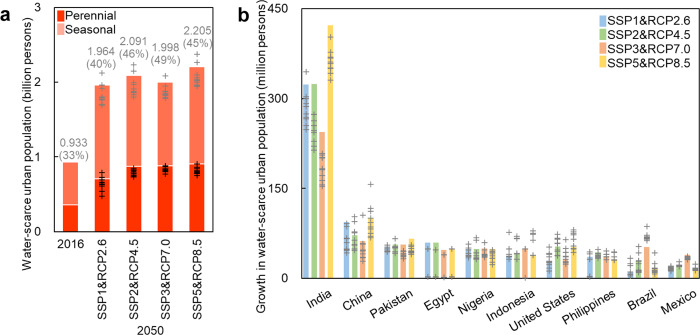
Fig. 2. Changes in urban water scarcity from 2016 to 2050.
a Changes in water-scarce urban population at the global scale. Bars present the simulated results using the ensemble mean of runoff from GCMs, the total values (i.e., perennial and seasonal), and percentages are labeled. Crosses (gray/black) present the simulated results (total/perennial) using runoff from each GCM. b Changes in water-scarce urban population at the national scale (10 countries with the largest values were listed). Bars present the total values simulated using the ensemble mean of runoff from GCMs. Crosses present the total values simulated using runoff from each GCM. Please refer to Supplementary Data for urban water scarcity in each catchment.

