FIGURE 7.
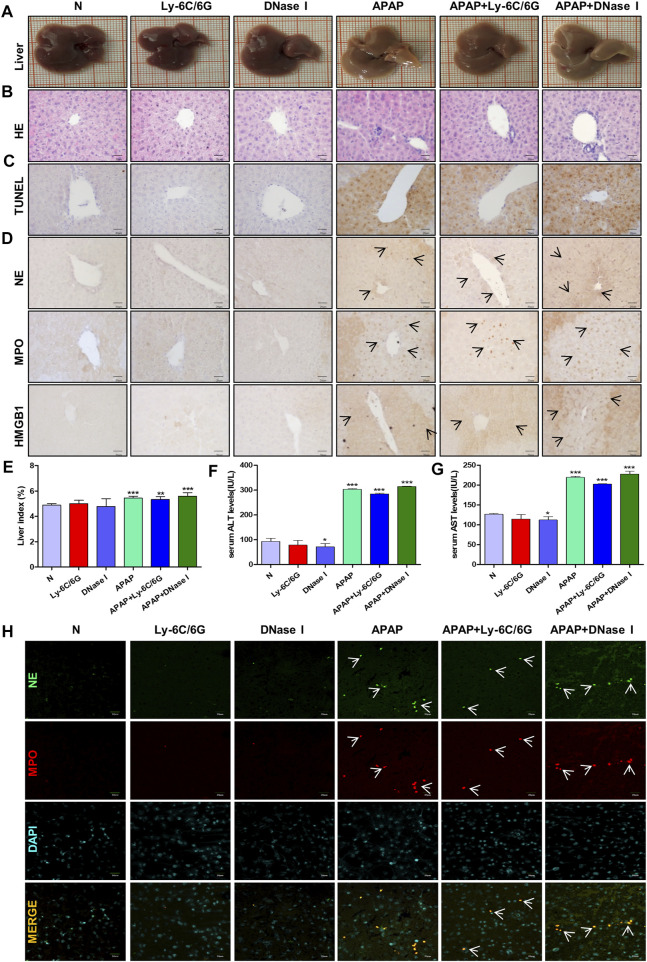
Effects of neutrophils and NETs on liver injury induced by APAP. C57BL/6 mice were randomly divided into six groups: normal group, Ly6C/6G group, DNase I group, APAP group, APAP + Ly6C/6G group and APAP + DNase I group. Ly6C/6G (200 μg/mouse) was injected intraperitoneally 24 h before APAP (300 mg/kg) treatment. DNase I (10 mg/kg) was injected intraperitoneally 1 h after APAP treatment. (A) Morphology of mouse liver tissue samples. (B,C) HE and TUNEL staining. (D) Immunohistochemical staining of NE, MPO and HMGB1. (E) Liver weight index. (F,G) The level of ALT and AST in serum. (H) Immunofluorescence staining of frozen sections of NE and MPO. Green and red fluorescent label NE and MPO, orange yellow label NE and MPO dual expression. All images were magnified by 400×. Specific staining indicated by arrow. *p < 0.05, **p < 0.01, ***p < 0.001, significantly different from the normal group. One-way ANOVA followed by Tukey’s test. The data are expressed as the mean ± SD of five independent assays with at least three replicates.

