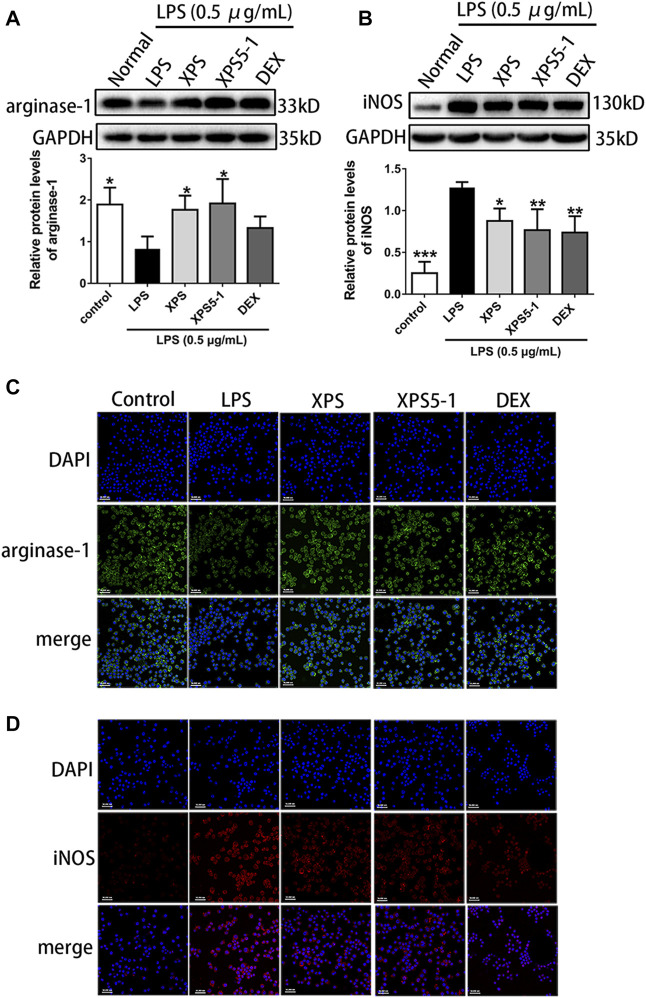
FIGURE 3.
Effects of XPS and XPS5-1 on protein expression in LPS-stimulated ANA-1 cells. Total cell lysates were collected for analyzing the expression of arginase-1 (A) and iNOS (B) by Western blot (n = 4, means ± SD). The effects of XPS, XPS5-1 (both 100 μg/ml), and DEX (20 μM) on the expression of arginase-1 (green) and iNOS (red) were detected by immunofluorescence, and cell nuclei were in blue (C, D). * p < 0.05, ** p < 0.01, and *** p < 0.001 vs. the LPS-stimulated group, analyzed by ANOVA and Bonferroni post hoc test.

