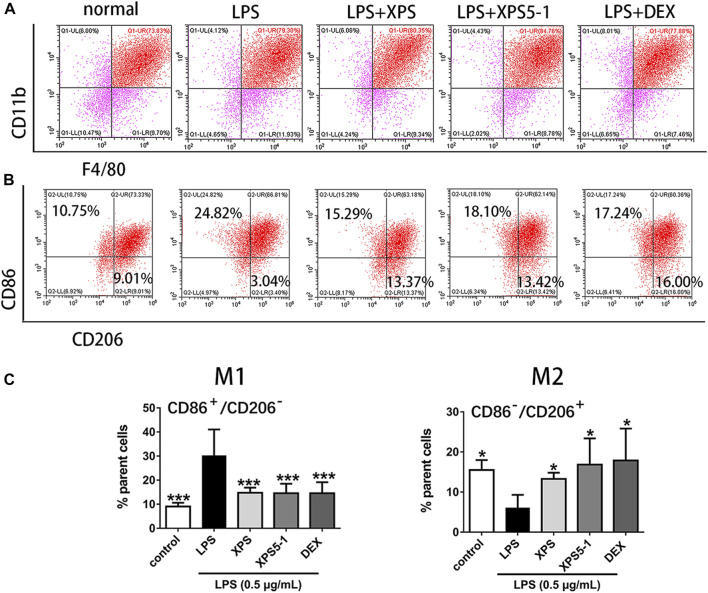
FIGURE 4.
Effect of XPS and XPS5-1 on LPS-induced macrophage polarization in ANA-1 cells. (A) Dot plots showing macrophages. (B) CD86+/CD206– (upper left area representing M1) and CD86–/CD206+ (lower right area representing M2) by flow cytometry. (C) Graphs showing the radio of these two phenotypes. ANA-1 cells were stimulated by LPS (0.5 μg/ml) with XPS, XPS5-1 (both 100 μg/ml), and DEX (20 μM) for 24 h. The cells were incubated with fluorescently labeled antibodies. The expression ratio was detected by flow cytometry (n = 4, means ± SD). * p < 0.05, ** p < 0.01, and *** p < 0.001 vs. the LPS-stimulated group, analyzed by ANOVA and Bonferroni post hoc test.

