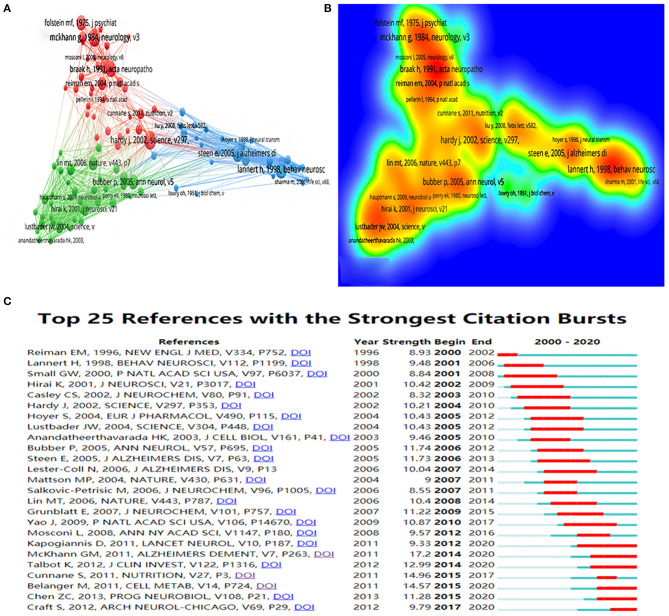
Figure 6.
(A) The co-citation network visualization map of references based on VOSviewer; (B) The density visualization map of references based on VOSviewer; (C) Top 25 references with the strongest citation bursts based on CiteSpace, The red horizontal stripes represent the years with the most frequent publications. The green horizontal stripes represent the years with the most infrequent publications.

