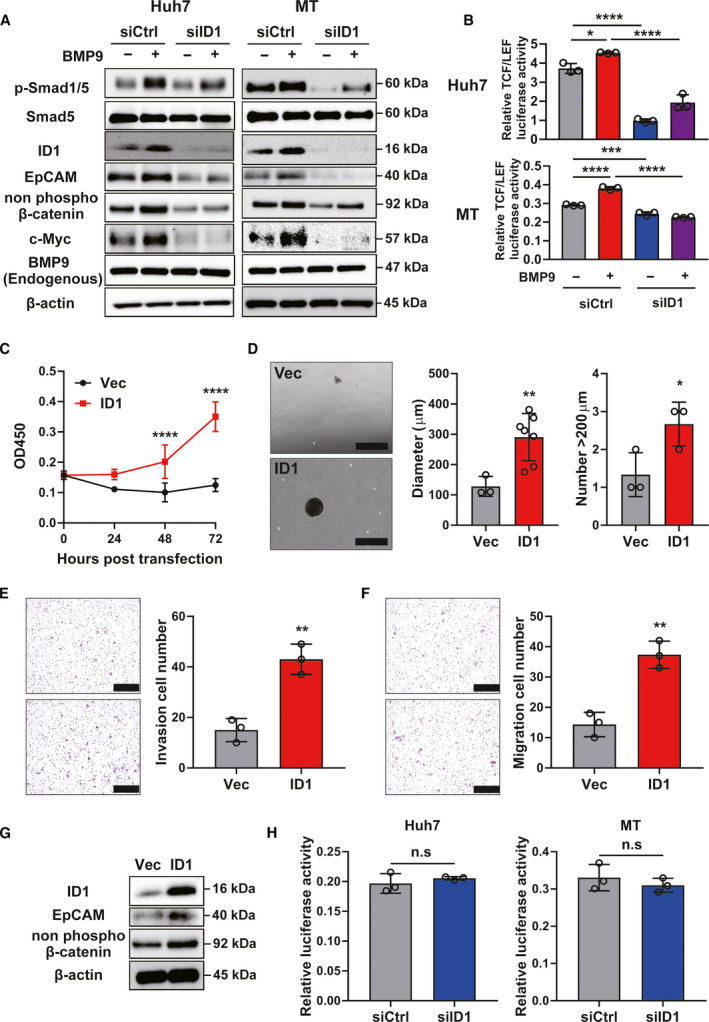
Fig. 4.

BMP9‐ID1 cooperatively regulates EpCAM+ HCC‐CSCs through activating Wnt/β‐catenin signaling. (A) Western blot images of ID1 knockdown Huh7/MT cells treated with or without BMP9. (B) Relative TCF/LEF luciferase activity in ID1 knockdown Huh7/MT cells treated with or without BMP9. (C) OD450 in cell proliferation assay of control vector (Vec) or ID1 vector (ID1)‐transfected MT cells. (D) Representative spheroid assay images, spheroid diameter, and number of spheroids (> 200 µm) of MT cells transfected with Vec or ID1. Scale bar = 500 µm. (E) Representative invasion assay images and relative cell numbers from invasion assay of MT cells transfected with Vec or ID1. Scale bar = 200 µm. (F) Representative migration assay images and relative cell numbers from migration assay of MT cells transfected with Vec or ID1. Scale bar = 200 µm. (G) Western blot images of Vec‐ or ID1‐transfected MT cells. (H) Relative luciferase activity in ID1 knockdown Huh7 and MT cells transfected with pGL4.10 containing 2151bp promoter/enhancer fragment of the EpCAM gene. Error bars represent the SD from at least three independent biological replicates. Student's t‐test was used to calculate P values represented as *P < 0.05, **P < 0.01, ***P < 0.001, ****P < 0.0001. n.s, not significant. [Colour figure can be viewed at wileyonlinelibrary.com]
