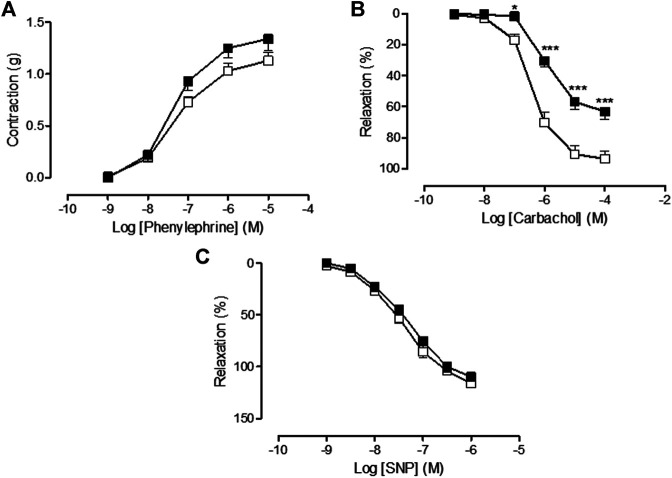
FIGURE 3.
(A) Concentration-response curve of phenylephrine (10−9 M–10−5 M), (B) concentration-response curve of carbachol (10−9 M–10−4 M), and (C) concentration-response curve of sodium nitroprusside (SNP) (10−9 M–10−6 M) in isolated rat aorta rings from animals chronically treated with saline (saline treatment, white squares) or vincristine (vincristine treatment, black squares). Values are expressed as mean ± SEM, n = 11–21 preparations per experimental group. A two-way ANOVA followed by the Bonferroni test was used for statistical analysis (***p < 0.001, *p < 0.05, vincristine treatment vs. saline treatment).

