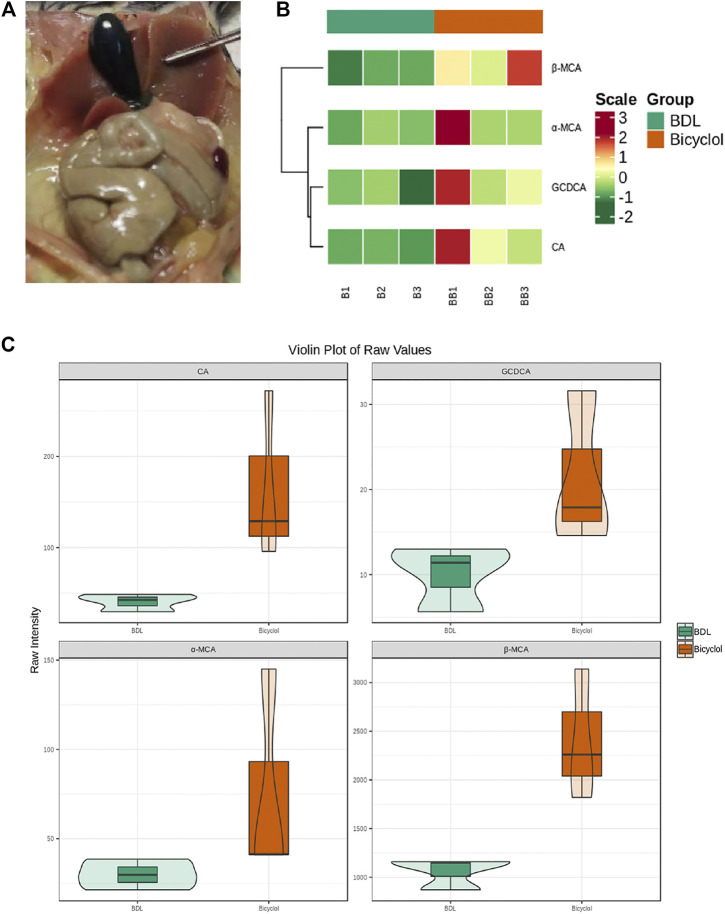
FIGURE 2.
Bile acid composition in the gallbladder. (A) The gallbladder of BDL mice. (B) Heatmap of differential bile acids of gallbladder bile samples. Rows represent different bile acids, while columns represent different samples. Colors from green to red indicate increasing levels from low to high. (C) Violin plot analysis comparing the levels of CA, GCDCA, α-MCA, β-MCA in the BDL and Bicyclol groups. Green represents the BDL group, whereas orange represents the Bicyclol group.

