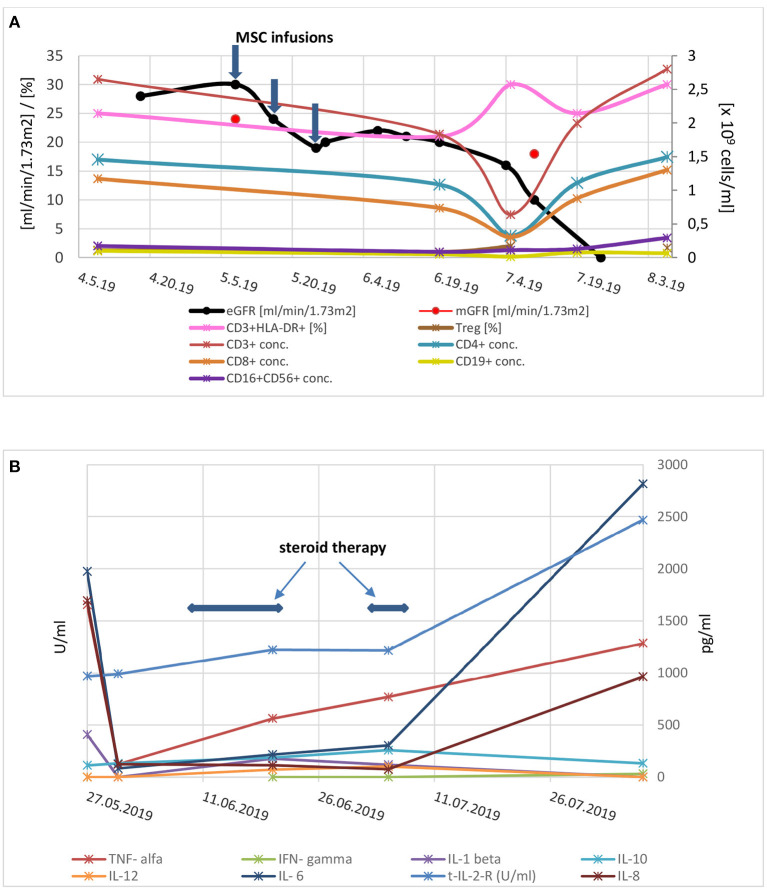
Figure 2.
(A) Kidney graft function and serum concentrations of lymphocyte populations before and after application of mesenchymal stem cells. Three consecutive applications of mesenchymal stem cells are marked with arrows. eGFR, estimated glomerular filtration rate; mGFR, measured glomerular filtration rate (by Cr-EDTA); conc, concentration; Treg, regulatory T cells. (B) Cytokine concentrations after mesenchymal stem cells application (in U/mL for soluble interleukin 2 receptor and in pg/mL for other cytokines). Time frame of corticosteroid treatment is marked with arrows; Legend: TNF, tumor necrosis factor; IL, interleukin; s-IL-2-R, soluble interleukin 2 receptor; IFN, interferon.

