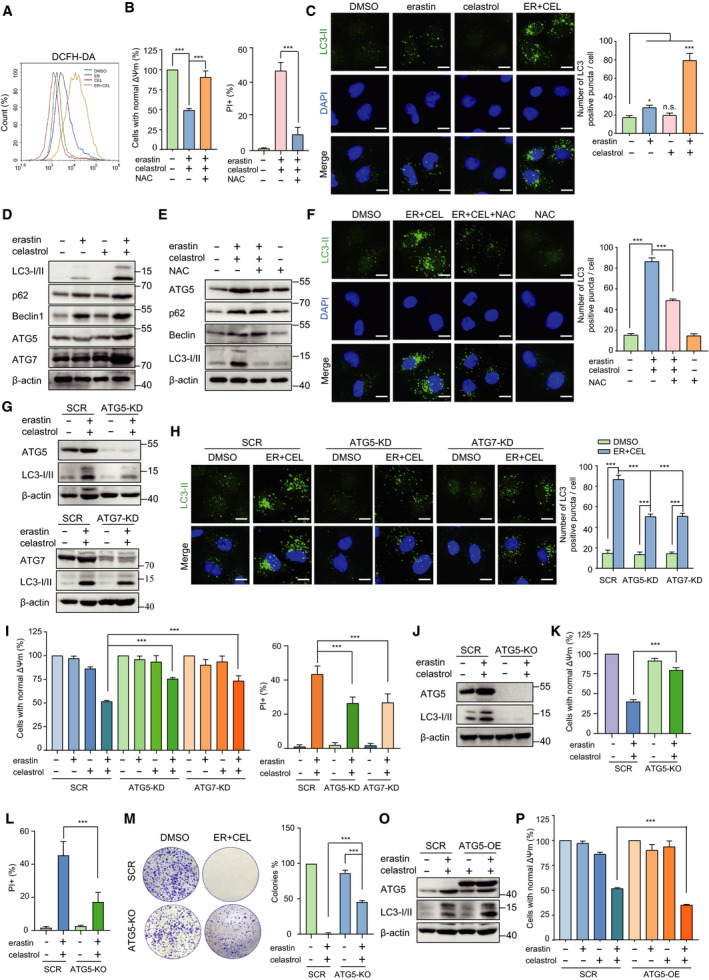
Fig. 3.

Cotreatment with celastrol and erastin induced ROS‐dependent autophagy. (A) HCC827 cells were cotreated with celastrol and erastin for 24 h. Cells were stained with DCFH‐DA, and the fluorescence intensity was examined by flow cytometry. (B) HCC827 cells were cotreated with erastin and celastrol in the presence or absence of NAC (0.5 mm) for 24 h, and cell viability and cell death were measured by CCK‐8 and PI assays. (C) Representative images of LC3II puncta formation after treatment with either erastin or celastrol or their combination for 24 h. Scale bars, 10 µm. (D) Autophagy‐related proteins, including ATG5, ATG7, p62, Beclin‐1, and LC3, were detected by western blotting after cotreatment with celastrol and erastin for 24 h. (E) HCC827 cells were cotreated with erastin and celastrol in the presence or absence of NAC for 24 h. Autophagy‐related proteins, including ATG5, ATG7, p62, Beclin‐1, and LC3‐I/II, were detected by western blotting. (F) HCC827 cells were treated as described in E. Representative images of LC3‐II puncta formation are presented. Scale bars, 10 µm. (G) Western blotting demonstrated the knockdown of ATG5 or ATG7 prevented up‐regulation of autophagy‐related genes. (H) Representative images of LC3‐II puncta formation in SCR, ATG5‐KD, and ATG7‐KD cells. All the indicated cells were treated with erastin and celastrol for 24 h. Scale bars, 10 µm. (I) CCK‐8 and PI assays showing that ATG5 or ATG7 knockdown mitigated cell death induced by cotreatment with celastrol and erastin. (J) ATG5 knockout in HCC827 cells. (K, L) ATG5 knockout substantially alleviated erastin‐ and celastrol‐induced cell death. (M) Representative images of colony formation of SCR and ATG5‐KO cells after erastin and celastrol cotreatment. (O) Western blotting showing overexpression of ATG5 enhanced LC3‐II up‐regulation. (P) Overexpression of ATG5 potentiated cell death induced by cotreatment with celastrol and erastin. The mean ± SD is shown, n = 3. Statistical significance was determined using one‐way or two‐way ANOVA with Tukey’s post hoc test. ***P < 0.001.
