Fig. 4.

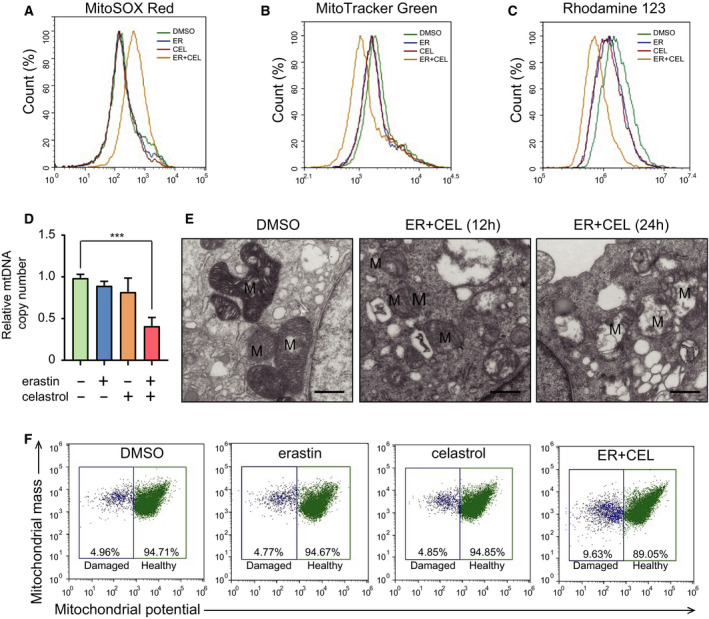
Cotreatment with celastrol and erastin induced mitochondrial dysfunction in HCC827 cells. (A) Mitochondrial ROS generation was assessed using flow cytometry using the MitoSOX™ Red mitochondrial superoxide indicator. (B) Mitochondrial membrane potential was determined after treatment. Cells were stained with a Rhodamine‐123 probe and analyzed by flow cytometry. (C) Mitochondrial mass was assessed by flow cytometry after staining with the MitoTracker Green probe. (D) Mitochondrial copy number was examined by real‐time PCR. (E) TEM was used to indicate the mitochondrial morphology. Intact cristae and normal morphological characteristics were observed in HCC827 cells. Swollen mitochondria with fractured cristae appeared in celastrol‐ and erastin‐treated cells. M, mitochondria. Scale bars, 0.5 µm. (F) Flow cytometry to distinguish populations with normal membrane potential (healthy mitochondria) from those with reduced membrane potential (damaged mitochondria) among HCC827 cell populations. The mean ± SD is shown, n = 3. Statistical significance was determined using one‐way ANOVA with Tukey’s post hoc test. ***P < 0.001.
