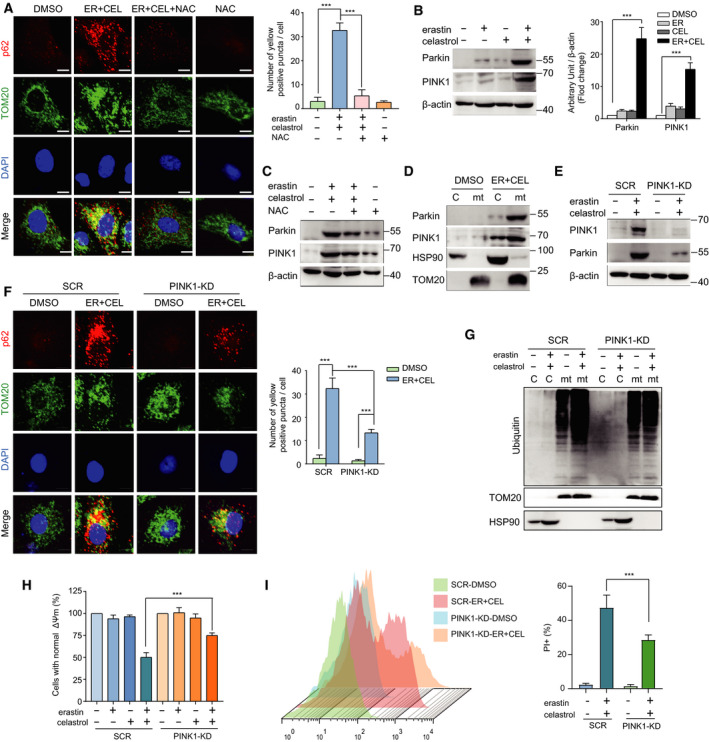
Fig. 5.

Cotreatment with celastrol and erastin induced PINK1/Parkin‐dependent mitophagy. (A) Colocalization of p62 and TOM20 was visualized under confocal microscopy. Representative fluorescent images of cells immunostained with p62 and TOM20 after erastin and celastrol cotreatment for 24 h are shown. The yellow dots in the merge panel indicated the activation of mitophagy. Scale bars, 10 µm. (B) Western blotting was used to measure the protein levels of PINK1 and Parkin in HCC827 cells treated with celastrol and erastin for 24 h. (C) HCC827 cells were cotreated with erastin and celastrol in the presence or absence of NAC for 24 h. The expression levels of PINK1 and Parkin were detected by western blotting. (D) Western blotting analysis of PINK1 and Parkin in the cytosolic and mitochondrial fractions of HCC827 cells treated with erastin and celastrol for 24 h. (E) Western blotting analysis of the effect of PINK1 knockdown on the expression of Parkin. (F) Colocalization of p62 and TOM20 was reduced in PINK1‐KD cells. Representative fluorescent images of cells immunostained with p62 and TOM20 after cotreatment with celastrol and erastin for 24 h are shown. Scale bars, 10 µm. (G) Ubiquitination levels of protein in the cytosolic and mitochondrial fractions in SCR and PINK1‐KD cells were determined by western blotting. (H, I) Cell viability and cell death were measured by CCK‐8 and PI assays. The mean ± SD is shown, n = 3. Statistical significance was determined using two‐way ANOVA with Tukey’s post hoc test. ***P < 0.001.
