Fig. 3.

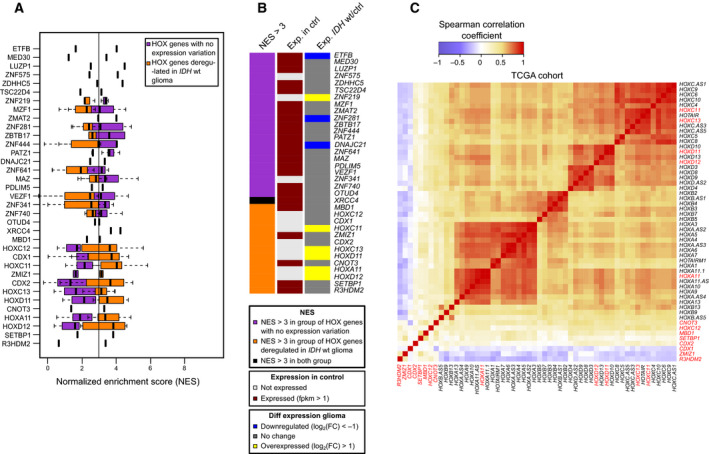
Expression of HOX transcription factors and HOX genes in IDHwt glioma samples. (A) Transcription factor motif enrichment in the promoter of HOX genes (defined as ±1 kbp of RefSeq TSS), calculated using i‐cis Target and represented as normalized enrichment score (NES). Orange squares, genes upregulated in IDHwt glioma; purple squares, genes that are not deregulated in IDHwt glioma. When a transcription factor harbors several binding motifs, data are presented as a box plot. (B) Expression status, assessed by RNA‐seq, of the transcription factors identified in A. The middle column shows their expression status in healthy brain controls (n = 3) (gray, not expressed; burgundy, expressed: FPKM > 1) and the right column their expression in IDHwt glioma samples (n = 8) compared with controls (blue, downregulated: log2(FoldChange) < −1; gray, no change; yellow, overexpressed: log2(FoldChange) > 1). The left column shows the motif enrichment specific to HOX genes that are not deregulated (purple) or deregulated (orange) in IDHwt glioma and in both categories (black). (C) Heatmap of the correlation between all HOX genes and the transcription factors identified in A (in red), established using publicly available RNA‐seq data from 134 IDHwt samples (TCGA cohort). FPKM, fragment per kilobase per million reads.
