
Fig. 5.
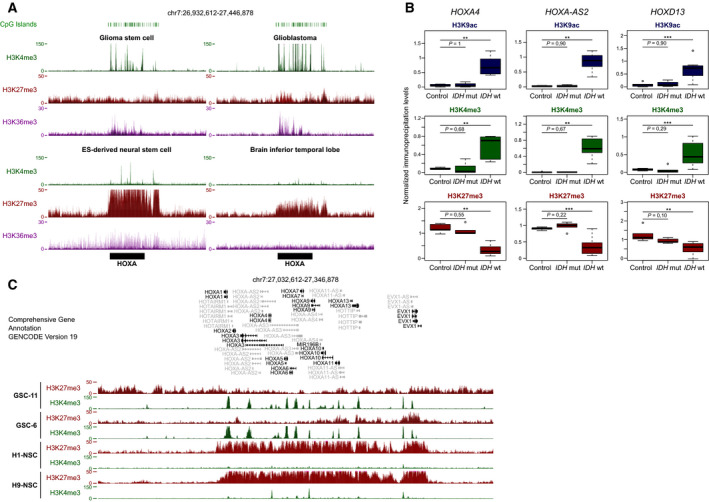
HOX clusters are depleted for H3K27me3 in IDHwt glioma and GSC lines. (A) Data mining‐derived ChIP‐seq signal at the HOXA cluster for H3K4me3 (green), H3K27me3 (red), and H3K36me3 (purple) in GSC and IDHwt glioma‐derived cell lines (upper panels) and healthy neural stem cell (NSC) and brain tissues (lower panels). (B) ChIP analysis of H3K9ac, H3K4me3, and H3K27me3 at selected HOX genes in control brain samples (n = 5), and in IDHmut (n = 5) and IDHwt (n = 7) glioma samples. The precipitation level was normalized to that at the TBP promoter (for H3K4me3 and H3K9ac) and at the SP6 promoter (for H3K27me3); **P < 0.01, ***P < 0.001 (Mann–Whitney U‐test). (C) ChIP‐seq signal at the HOXA cluster for H3K4me3 (green) and H3K27me3 (red) in two independent GSC lines and in two independent NSC lines.