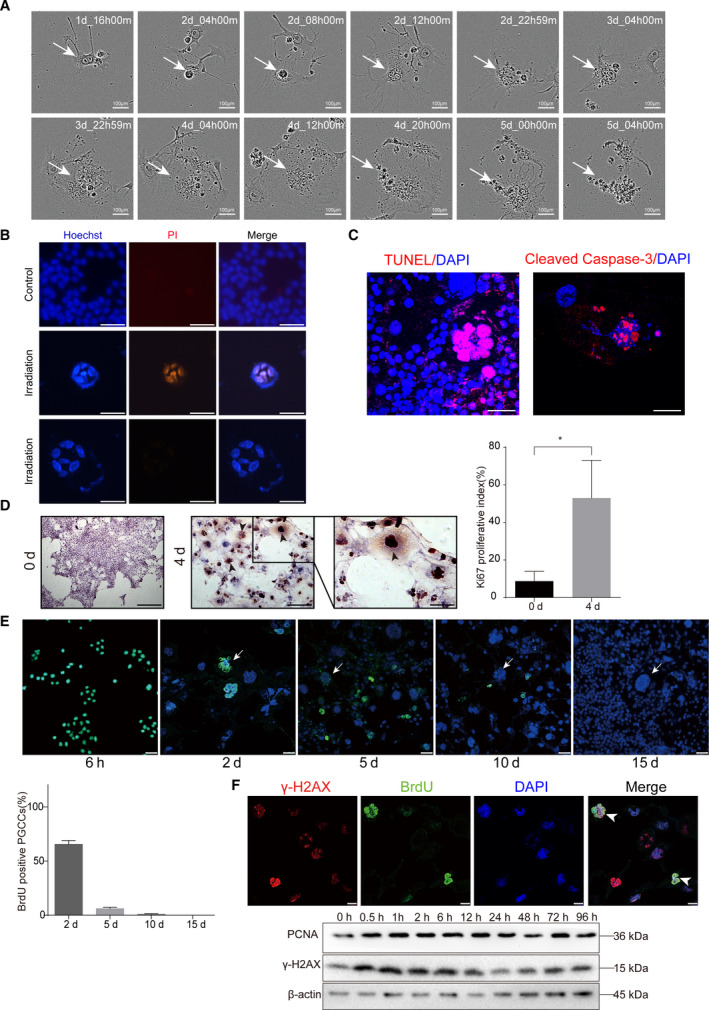
Fig. 2.

Irradiation‐induced PGCCs possessed proliferation potential. (A) Time‐lapse microscopy monitored the demise process of PGCCs. (B) Hoechst 33342/PI double staining showed that irradiation‐induced PGCCs underwent apoptosis. Scale bar: 100 μm. (C) TUNEL and Cleaved Caspase‐3 staining showing positive staining for some PGCCs. Scale bar: 50 μm. (D) Left panel, representative picture showing Ki67 staining for non‐irradiation cells and PGCCs. (Left panel, Ki67 staining in non‐irradiation cells. Scale bar: 250 μm. Middle panel, Ki67 staining in irradiation‐induced PGCCs. Scale bar: 100 μm. Right panel, a high‐magnification image to show positivity of Ki67 staining in PGCCs. Scale bar: 50 μm. Right panel, quantitative analysis showing the Ki67 proliferative index. (E) BrdU pulse‐chase assay to track BrdU‐labeled PGCC cells. Arrows indicated PGCCs. Scale bar: 50 μm. Lower panel, quantitative analysis showing the BrdU positive PGCCs percentage. (F) Upper panel, immunofluorescence staining showing irradiation induced PGCCs proliferated in spite of DNA damage. Lower panel, western blot analysis showing the PCNA, marker of proliferation, and γ‐H2AX, marker of DNA damages increased synchronously after 10Gy irradiation over time. Scale bar: 25 μm. n = 5, data are shown as mean ± SD. Student’s t‐test was used to determine statistical significance: *P < 0.05, **P < 0.01. [Colour figure can be viewed at wileyonlinelibrary.com]
