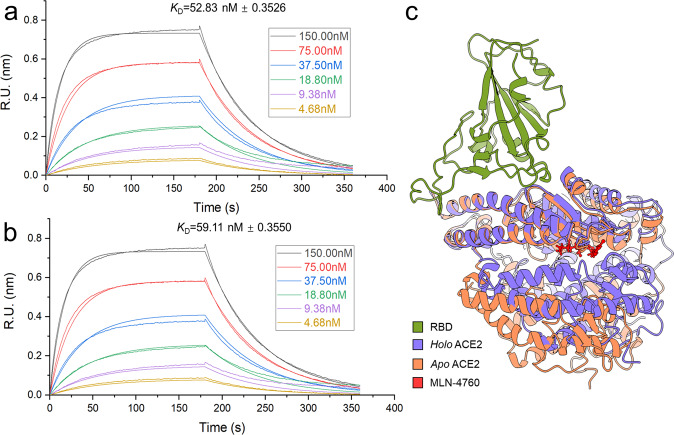
Fig. 1. Comparison of RBD binding affinities with Apo ACE2 and ACE2 treated with MLN-4760 by BLI.
Association and dissociation curves of RBD with Apo ACE2 (a) or ACE2 treated with MLN-4760 (b) in a concentration range between 4.68 nM and 150 nM. The number that follows the ±sign is the standard deviation (SD). (c) Comparison of binding conformations between the binding complex of RBD with Apo ACE2 (PDB code: 1R42) and Holo ACE2 (PDB code: 1R4L). The conformational alignment was performed on the first 100 residues at the N-terminus of ACE2.

