FIGURE 1.
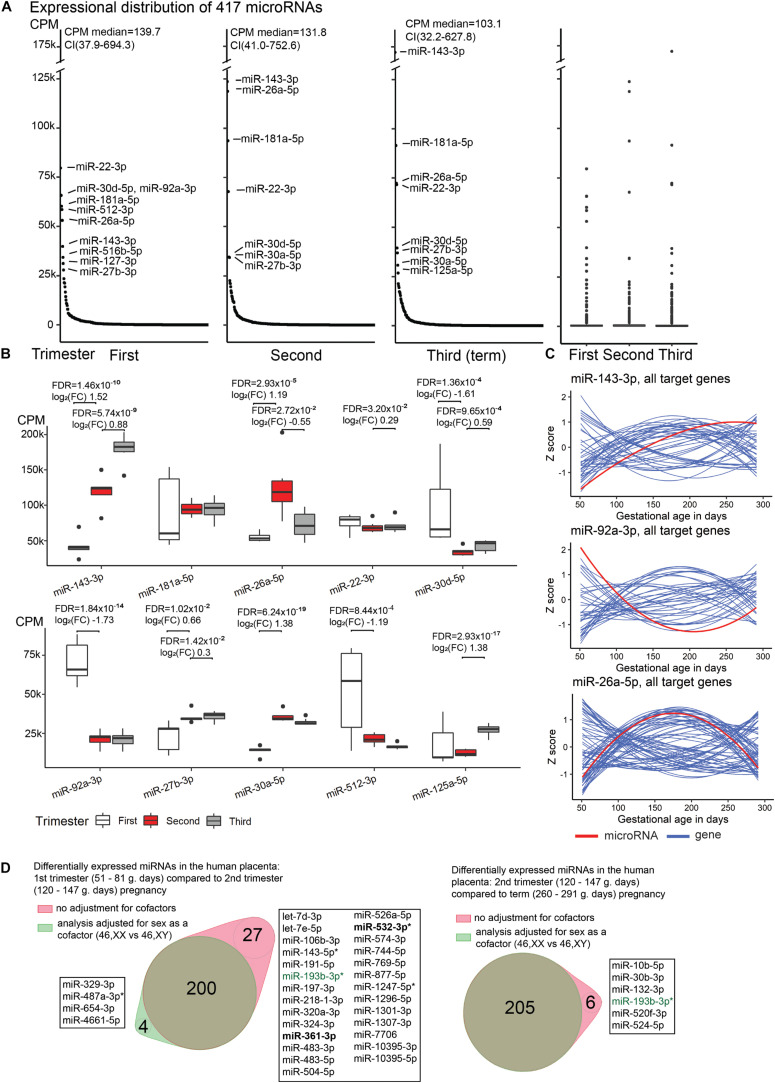
Expressional distribution of placental miRNome. (A) Transcript levels of the analyzed 417 miRNAs in the first (median 60; range 51–81 g.days) and second trimester (121; 108–140 g.days) and term placental samples (284; 260–291 g.days). miRNA expression was quantified in counts per million reads mapped (CPM). Highly expressed miRNAs (CPM > 25,000) are indicated. Full details are provided in Supplementary Table 1. (B) Trimester-specific expression levels of placental miRNAs with the highest transcript levels. Differential expression testing between the three trimesters of pregnancy was implemented in DESeq2 (ver. 1.22.2) (Love et al., 2014) package for R with default settings. Log2(FC), log2 fold change in CPM; FDR, false discovery rate, calculated based on Benjamini–Hochberg method. (C) Gestational expression dynamics of some most highly transcribed placental miRNAs miR-143-3p, miR-92a-3p, miR-26a-5p compared to the transcript levels of their high-confidence target genes predicted in the miRTarBase (n = 47, 39, 74, respectively). Transcriptome data were derived from the published RNA-Seq datasets of the same placental samples representing first (n = 5) and second (n = 7) trimester, and normal term pregnancy (n = 8) (Sõber et al., 2015; Pilvar et al., 2019). miRNA and gene expression levels are presented in Z-scores; expression data for miRNA is shown in red and for target genes in blue. (D) Differentially expressed placental miRNAs between first (M/F, n = 2/3) and second trimester (n = 4/3), second trimester and term pregnancy (n = 5/3) samples, with or without incorporating fetal sex (46, XY vs. 46, XX) as a cofactor. X-linked miRNAs are highlighted in bold and differentially expressed miRNAs in preeclampsia are indicated with asterisk (*). miR-193-3p (green) showed sex-modulated transcript levels in both comparisons. F, female; M, male.

