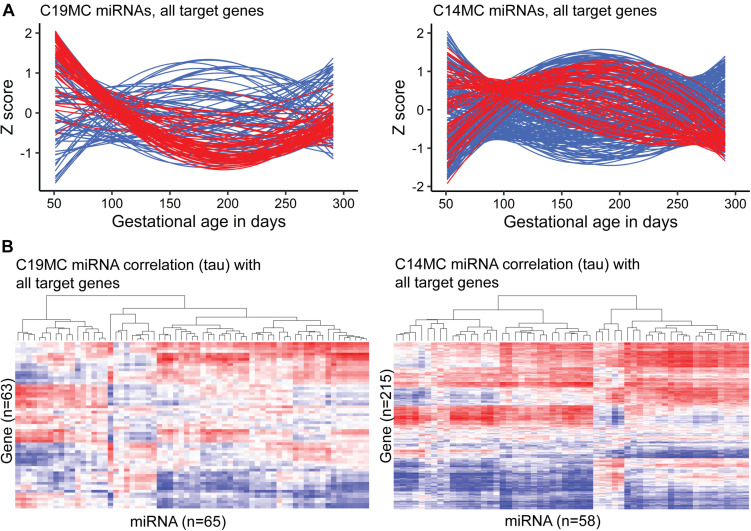
FIGURE 3.
Expression dynamics of C19MC and C14MC miRNA clusters across gestation compared to the transcript levels of their miRTarBase target genes. Placental transcript levels were confidently quantified for 63/76 and 215/262 predicted target genes of C19MC and C14MC, respectively. (A) miRNA and gene expression levels during pregnancy presented in Z-scores; expression data for miRNAs is shown in red and for target genes in blue. (B) Heatmap and hierarchical clustering of miRNA–target gene expression data based on the calculated correlation coefficient Kendall tau.

