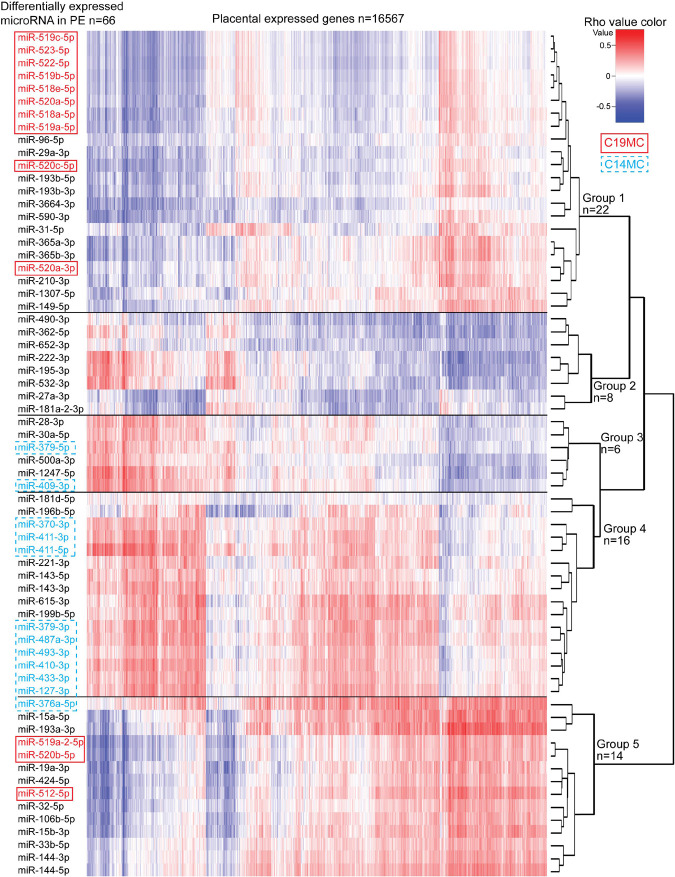
FIGURE 5.
Correlation analysis between miRNAs altered in preeclampsia and the whole transcriptome of 40 term placental samples. Expressional correlation of 66 miRNAs with mRNA transcripts of 16,567 genes (RNA-Seq data from Sõber et al., 2015) was evaluated using Spearman’s correlation coefficient (parameter rho). Spearman’s rho was estimated for 1,093,422 miRNA-gene pairs (Supplementary Data 1). The heatmap shows the hierarchical clustering of miRNAs based on the expressional correlation with mRNA transcripts of coding/lincRNA genes. Each row represents one miRNA and each column one gene. Expressional correlation is presented from –1 (maximum negative correlation, blue color) to 1 (maximum positive correlation, red). The value 0 indicates no correlation. miRNAs groups G1-G5 were formed based on their clustering. More details on genes with correlated expression in each miRNA group G1–G5 are presented in Supplementary Tables 28–32.

