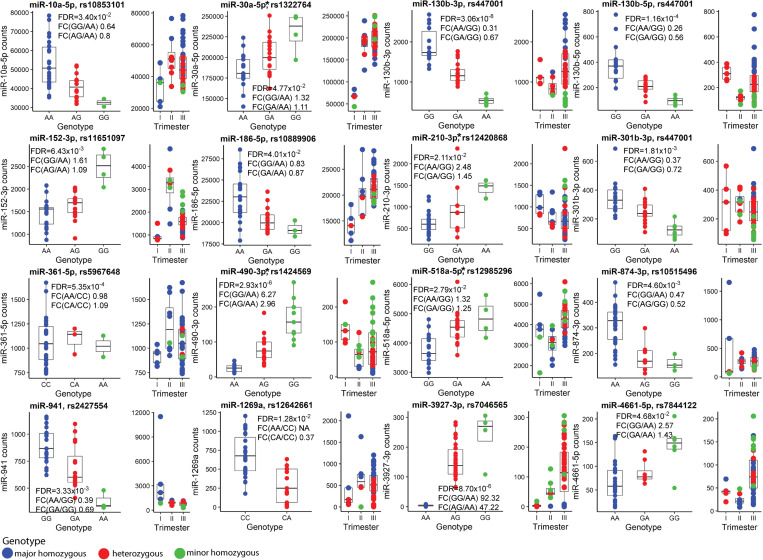
FIGURE 6.
Placental miRNA expression Quantitative Trait Loci (miR-eQTLs). Discovery analysis of single nucleotide variants (SNVs) modulating the expression of flanking miRNAs was carried out in 40 term placental samples and the most significant miR-eQTLs are presented. In each subgraph, miRNA normalized read counts (y-axis) are shown for samples stratified based on SNV genotypes (x-axis). Blue, red and green colors represent placentas homozygous for the major allele, heterozygous or homozygous for the minor allele of SNV, respectively. Additionally, distribution of genotype-stratified samples in the trimesters are shown. miRNAs that are also differentially expressed in term preeclampsia are indicated with an asterisk (*). Further details are presented in Supplementary Tables 1, 21, 33 and Supplementary Data 1. FDR, false discovery rate; FC, fold change.

