Figure 6.
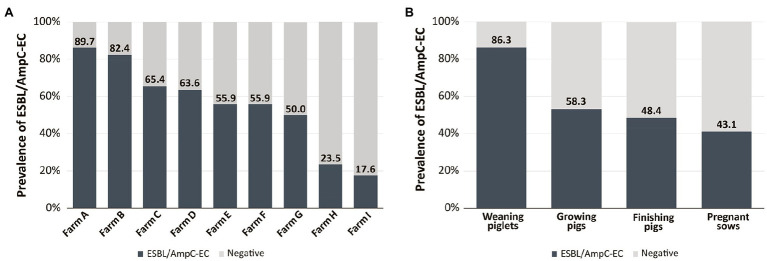
k-means similarity clustering plot: similarity in the clonal distribution among swine production stages within farms. A total of 33 points were described and clustered into 9 (symbols and colors) using the k-means similarity clustering algorithm based on Euclidean distance. The k-means cluster plot was generated using the R software (ver. 4.3.2). Each point indicates the distribution of STs among swine production stages in each farm, consisting of 36 points based on combination of 9 farms (A to I) and 4 production stages (1, weaning piglets; 2, growing pigs; 3, finishing pigs; and 4, pregnant sows; e.g., A1 presents the clonal distribution of “Weaning piglets” of “Farm A”). Three points (H2, H4, and I2) were excluded as no ESBL/AmpC-EC strains were isolated from “Growing pigs” of “Farm H”, “Pregnant sows” of “Farm H,” and “Growing pigs” of “Farm I.”

